Vistra · VST
Vistra's first 2027 guidance already absorbs the slide in Texas power prices
Vistra's 2027 earnings guidance landed where its August comments pointed, about $0.2 billion below a simple sum of its February figures, by our arithmetic, and its 2030 cash goal assumes heavy share buybacks.
3 min read Published on

Published by
Inve Content team
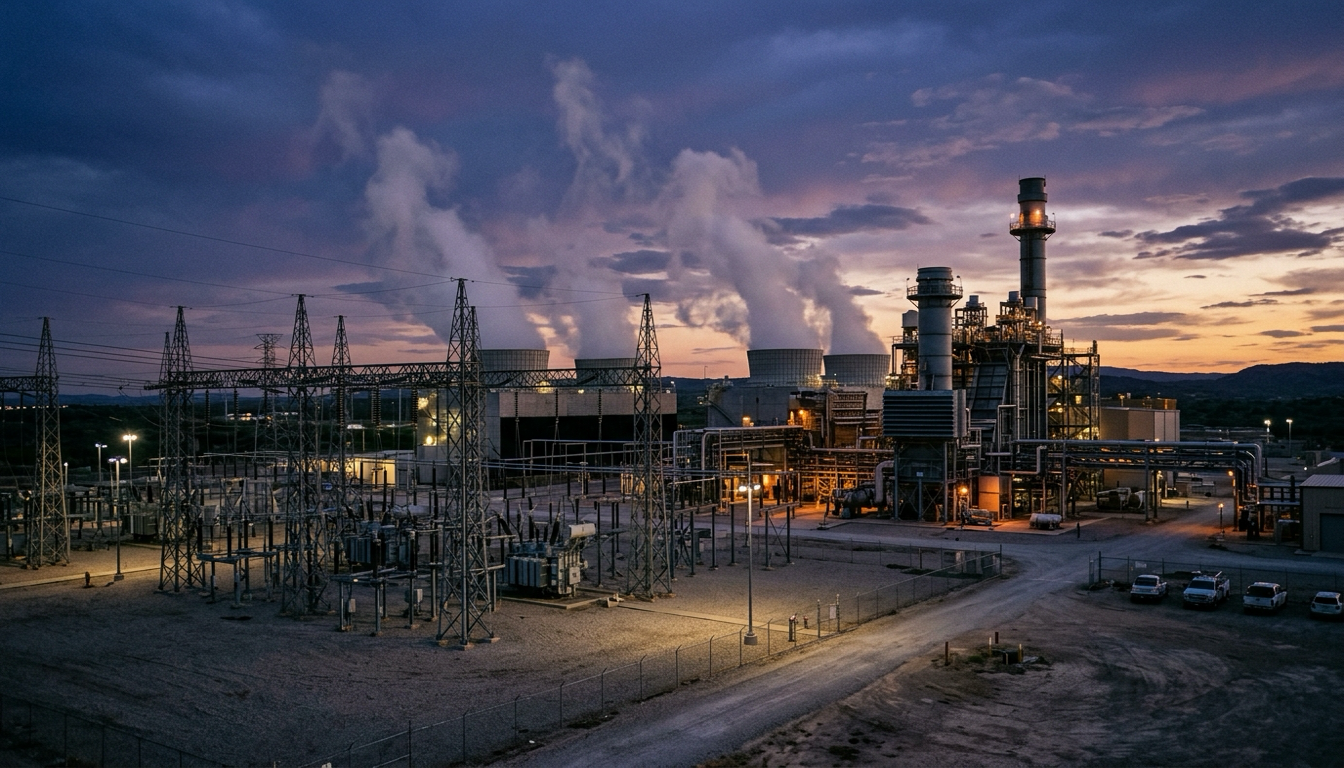
Vistra's first formal guidance for next year, given on 6 November, shows that the fall in Texas power prices has already reached its earnings. The company, which owns gas, nuclear and coal plants and sells power to homes and businesses, put the midpoint of next year's adjusted EBITDA guidance at $8.1 billion. That measure is earnings before interest, tax, depreciation and amortisation, with hedge gains and some other items removed. It now includes the Cogentrix gas plants Vistra finished buying in October and a contract to sell power from its Perry nuclear plant to Meta.
Management's comments allowed a rough estimate in advance. A year earlier, before either deal existed, Vistra offered a range it called an opportunity, not guidance. In February its chief financial officer, Kristopher Moldovan, put a figure on what the two deals would add, leaving aside any moves in forward power prices, while cautioning that it could not simply be stacked on the earlier range; added to the middle of that range anyway, by our arithmetic, it would have pointed higher than the guidance now does. By August he said Texas forward prices were well below where they had stood when the range was set, so next year was heading toward its lower end, and he repeated the estimate for the deals. That arithmetic gave exactly where the guidance landed, about $0.2 billion short of a simple sum of February's figures.
Vistra's 2027 guidance landed on August's arithmetic, about $0.2 billion below February's
$bn
- Nov 2025: opportunity range midpoint $7.6 billion
- Feb 2026: midpoint plus the two deals $8.3 billion
- Aug 2026: lower end plus the two deals $8.1 billion
- Nov 2026: guidance midpoint $8.1 billion
The comparison is not exact. The old figure was looser than formal guidance, and Moldovan's February estimate explicitly excluded price moves, so the shortfall is price changes and other items together rather than one measured cause. One detail points to the older fleet carrying more of it: James Burke, the chief executive, said the company's forecast for Cogentrix's earnings has meaningfully improved since the purchase was announced. If the new plants are worth more than the company first estimated, the rest of the business is contributing less.
Burke placed the cause on the Texas grid, where prices have been drifting lower. Demand from data centres is arriving later than planned, because sites approved to connect have been held back while the state audits them and pauses permits; he expects the hold might lift around mid-December. His longer view of demand growth in Texas did not change. Almost all of next year's expected output was already sold forward at the end of October, so the new range mostly reflects prices Vistra has locked in; in Texas the year after is much less covered.
None of this comes from a weak year in hand. Vistra narrowed its range for this year and raised the midpoint, after a September 2026 quarter in which adjusted EBITDA rose by about half, with Texas supplying more than half of the increase.
The figure many holders watch is free cash flow before growth spending, per share. In February Moldovan showed an illustrative figure built on this year's original guidance plus the two deals and assumed buybacks, which he described as a short-term number rather than a projection. Now he gives dated figures for next year and for 2030, and the later one, about $24, sits inside the band he gave in February. What carries 2030 is set out plainly. "We are not making any assumptions about power price recoveries," Burke said. The cash left after committed buybacks, dividends and announced projects is assumed to go into more buybacks. "So we're effectively in this chart, assuming a roughly $3 billion a year of share repurchases," Moldovan said.
Vistra's 2030 cash per share stays inside the band it gave in February
$ per share
- Feb 2026: illustrative, not dated $16
- 2027, November view $14
- 2030, November view $24
The board enlarged the buyback authorisation, and Burke said the bar for new projects rises when buying shares back is the other use for the cash.
The record: full financial tables
Financials
Income statement, last 8 quarters
| Quarter end | Sales | YoY | Operating profit | Op. margin | PBT | Net profit |
|---|---|---|---|---|---|---|
| Sep 2026 | 6,347 | +27.7% | 1,706 | 26.9% | 1,496 | 1,140 |
| Jun 2026 | 4,017 | −5.5% | 553 | 13.8% | 427 | 305 |
| Mar 2026 | 5,640 | +43.4% | 1,499 | 26.6% | 1,212 | 1,029 |
| Dec 2025 | 4,584 | +13.5% | 474 | 10.3% | 308 | 233 |
| Sep 2025 | 4,971 | −20.9% | 1,037 | 20.9% | 856 | 652 |
| Jun 2025 | 4,250 | +10.5% | 515 | 12.1% | 403 | 327 |
| Mar 2025 | 3,933 | +28.8% | −120 | −3.1% | −444 | −268 |
| Dec 2024 | 4,037 | +31.1% | 599 | 14.8% | 451 | 441 |
Balance sheet
| As of | Equity | Debt | Cash | Fixed assets | Total assets |
|---|---|---|---|---|---|
| Sep 2026 | 6,306 | 18,269 | 2,743 | 19,089 | 45,029 |
| Jun 2026 | 5,482 | 17,719 | 435 | 19,944 | 42,603 |
| Mar 2026 | 5,597 | 17,264 | 634 | 19,876 | 41,308 |
| Dec 2025 | 5,097 | 17,642 | 785 | 19,846 | 41,550 |
Cash flow
| Year end | Operating | Investing | Financing | Free cash flow |
|---|---|---|---|---|
| Dec 2025 | 4,070 | −4,396 | −74 | 1,318 |
| Dec 2024 | 4,563 | −5,276 | −1,604 | 2,485 |
| Dec 2023 | 5,453 | −2,145 | −294 | 3,777 |
| Dec 2022 | 485 | −1,239 | −80 | −816 |