
Vail Resorts · MTN
Vail's recovery year is guided, at the midpoint, to earn less than FY25 did, on more revenue and fewer passes
Vail Resorts guided fiscal 2027 profit to about where it stood before a weak winter, even on higher revenue, while season pass units are still falling and net debt has risen.
Published · Inve Research Desk
$835M
midpoint of guided fiscal 2027 Resort EBITDA
Slightly below the $844.1M earned before the weak winter, though the guide assumes 4.9% more resort revenue by our arithmetic.
How they did last quarter
The year ended on its revised target but well under the original one, and the seasonally loss-making final quarter was flat on a year earlier.
- Resort EBITDA, fiscal 2026$745.7M, down from $844.1M a year earliervs the 8 June guide: "and Resort reported EBITDA in the range of $735 million to $755 million."On target against the revised guide after the March and June cuts.
- Net income attributable, fiscal 2026$147.5M, down from $280.0M a year earliervs the 8 June guide: "We now expect net income attributable to Vail Resorts in the range of $128 million to $162 million"Inside the revised range, but about half of the prior year.
- Final-quarter resort revenue$272.1M, up 0.3% on a year agovs a Resort EBITDA loss of $122.4M against $123.6M a year earlierThe quarter that is a loss in summer barely changed; it did not drive the year.
A recovery year guided to earn less than FY25 did
Vail Resorts gave its first guidance for the next fiscal year on 28 September, and the number worth holding is $835M. That is the midpoint of the range it guided for Resort Reported EBITDA, the company's non-GAAP measure of profit for its mountain and lodging businesses, measured before interest, tax and depreciation. In the last full year before the bad winter the same measure came to $844.1M. By our arithmetic, the guide asks for 4.9% more resort revenue than that year in order to earn slightly less.
That is what a recovery looks like when guided costs are higher than in FY25: by our arithmetic, the guide implies resort costs about 7% above those of FY25. The company says it expects visitation to come back, but not all of it: US visitation, it now says, will not fully return to the earlier level.
The last guide was cut in March and June, then met
The record is why the number deserves care. In March the company cut its guide for the year just ended. On 8 June it cut again, to a range which the company put at about 14% below its original outlook at the midpoint. The year then came in almost exactly at that revised midpoint and well short of the original outlook.
In September the guide assumes US visitation will not fully return to FY25 levels, though the chief executive allowed that a normal winter could bring it back. A guide cut in March and again in June, then met, is a guide that was reset to something reachable. The question for the new one is whether it has been reset the same way.
Passes are still falling and the guide assumes no change
Season passes are the revenue booked before the snow falls. Through 18 September, units sold were down 12%, against 10% at the May deadline; the company says that, excluding auto-renew timing, the trend is unchanged. The chief financial officer said "we are not expecting an overall improvement during the rest of the selling season".
So the growth the guide needs has to come from lift tickets bought a day at a time and from spending on lessons, rentals and dining. Analysts asked how a pass base that is smaller in dollars turns into the resort revenue growth the guide implies by our arithmetic. The answers pointed to lift-ticket recapture and to how past winters went, and left the share coming from mix unquantified on the call.
The balance sheet is thinner than a year ago
Net debt is 3.9x trailing twelve-month Total Reported EBITDA against about 3.2x at the same date a year earlier by our arithmetic. Stockholders' equity is $240.5M, about 15% of what it was four fiscal years ago.
The dividend was held. By our arithmetic, declared dividends come to about $317M a year against free cash flow of $248.0M. The chief financial officer said the company expects positive free cash flow after its capital programme and dividends, even at the low end of guidance. Our rough test, before working capital, comes out short at that low end, so we cannot confirm it.
Debt and cash at quarter ends, Oct 2025 to Jul 2026
Debt rose from $3,108.3M to $3,186.4M while cash fell from $581.5M to $231.3M across the four quarter ends shown.
$ million
| Debt | Cash | |
|---|---|---|
| Oct 2025 | 3,108 | 582 |
| Jan 2026 | 2,858 | 385 |
| Apr 2026 | 2,950 | 371 |
| Jul 2026 | 3,186 | 231 |
Operating and free cash flow, fiscal years
Operating cash flow has fallen each year since FY23 ($637.9M to $479.6M); free cash flow was $248.0M in FY26, the lowest of the four years.
$ million
| Operating cash flow | Free cash flow | |
|---|---|---|
| Jul 2023 | 638 | 323 |
| Jul 2024 | 589 | 378 |
| Jul 2025 | 555 | 320 |
| Jul 2026 | 480 | 248 |
What would have to be true, and what we do not know
In our reading, for the guide to hold, lift-ticket buyers must refill the pass gap, ticket prices must hold, ancillary spending must grow, the weather must be normal, and the extra savings must outrun cost inflation. Nothing in that list is in hand today.
Management also has reason to show a credible plan. On the call it said it had received notices of intent to nominate directors, that the board was evaluating them, and that it would take no questions. The March and June calls had not mentioned a contest. The company said it had disclosed the notices in a release earlier in September, which we have not read; the call and the release give no names.
The evidence to watch arrives after the early-December pass deadline, with the final pass count, and in December with the 2027 capital plan. On this call, asked how the numbers add up, management answered with how past winters went. The pass count will settle it better than any recollection.
The record: notes, full financial tables
Notes
Impact 4/5 Guidance Mixed
Vail guides FY27 Resort EBITDA to $835M midpoint, $9.1M below FY25, on 4.9% more revenue
Vail Resorts guided fiscal 2027 Resort EBITDA, its non-GAAP profit measure for mountain and lodging, to $805M-$865M, a midpoint of $835M. That is below the $844.1M earned in fiscal 2025, on 4.9% more resort revenue by our arithmetic. On 8 June the company had guided fiscal 2026 to $735M-$755M and delivered $745.7M. The new guide assumes US visitation will not fully return to the fiscal 2025 level.
“implied resort EBITDA margin of 27.3%, excluding onetime costs, is expected to be approximately 200 basis points below our original fiscal 2026 outlook.”— Angela Korch, chief financial officer
Impact 4/5 Demand Negative
Vail pass units are down 12% through 18 September; guide assumes no improvement
Season pass units through 18 September were down 12% on the prior-year period, with days sold down 10% and dollars down 6%. At the May deadline the declines were 10%, 8% and 5%; the company says that, excluding auto-renew timing, the trend has not changed. The guide assumes no overall improvement in pass sales for the rest of the selling season, and the company says the weakness is concentrated in lower-frequency destination passes and that part of the decline may reflect delayed decision-making. The final pass update comes after the early-December deadline.
“we are not expecting an overall improvement during the rest of the selling season”— Angela Korch, chief financial officer
Impact 4/5 Balance sheet Negative
Vail net leverage is 3.9x, up from 3.2x a year earlier, as the $2.22 dividend is held
Net debt was 3.9x trailing twelve-month Total Reported EBITDA, a non-GAAP measure, at 31 July 2026, against 3.2x a year earlier by our arithmetic; liquidity is about $0.8B, down from $1.1B at 30 April 2026. The quarterly dividend was held at $2.22 a share, and by our arithmetic declared dividends of about $317M a year exceed fiscal 2026 free cash flow of $248.0M. The chief financial officer's expectation applies even at the low end of fiscal 2027 guidance; our rough test, before working capital, puts that end $20M-$35M short of the dividend, so we cannot confirm it.
“we expect to generate positive free cash flow after continuing to fund our capital program and dividends”— Angela Korch, chief financial officer
Impact 4/5 Risk Mixed
Vail confirms it has received notices to nominate directors and takes no questions on it
Chief executive Rob Katz said on 28 September that the company has received notices of intent to nominate people for election to its board, that the board is evaluating them, and that it would take no questions on the matter. Katz said the company had already disclosed the notices in a release earlier in September, which we have not read. The release lists stockholder activism and a potential proxy contest among its risks. Neither the 9 March nor the 8 June call mentioned nominations or activism.
“we have received notices of intent to nominate individuals for election to our Board of Directors.”— Rob Katz, chief executive officer
Financials
Income statement, last 8 quarters
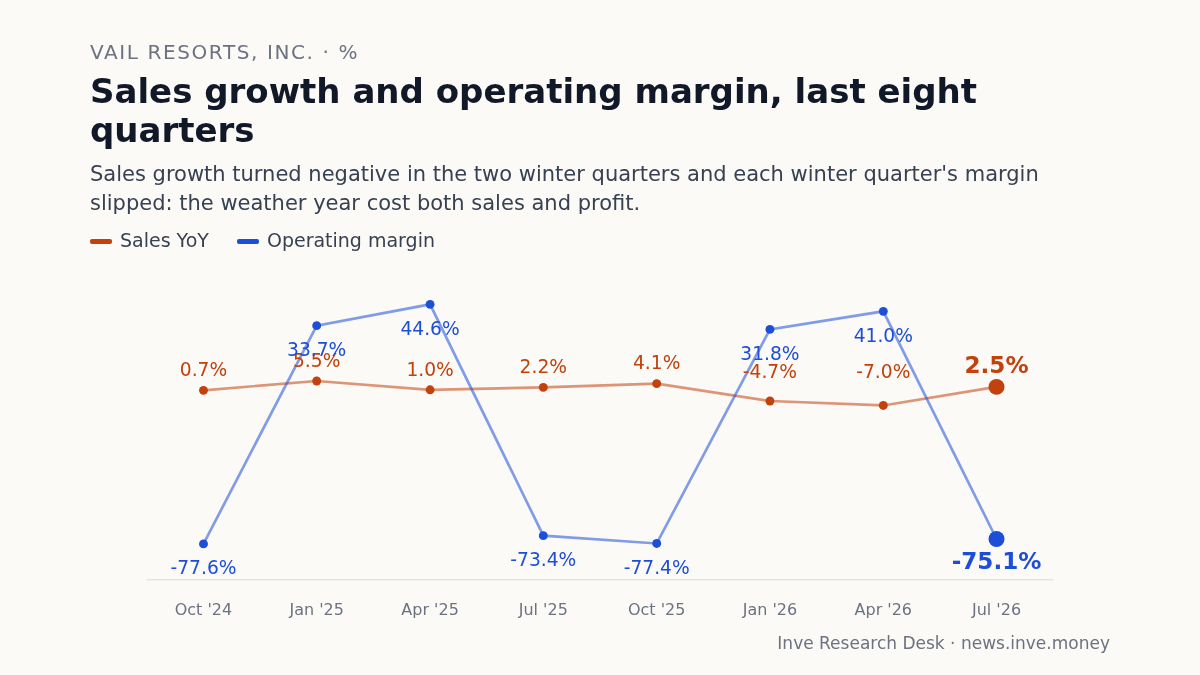
| Quarter end | Sales | YoY | Operating profit | Op. margin | PBT | Net profit |
|---|---|---|---|---|---|---|
| Jul 2026 | 278 | +2.5% | −209 | −75.1% | −260 | −190 |
| Apr 2026 | 1,205 | −7.0% | 494 | 41.0% | 446 | 314 |
| Jan 2026 | 1,084 | −4.7% | 345 | 31.8% | 298 | 210 |
| Oct 2025 | 271 | +4.1% | −210 | −77.4% | −257 | −187 |
| Jul 2025 | 271 | +2.2% | −199 | −73.4% | −242 | −181 |
| Apr 2025 | 1,296 | +1.0% | 578 | 44.6% | 541 | 390 |
| Jan 2025 | 1,137 | +5.5% | 383 | 33.7% | 343 | 244 |
| Oct 2024 | 260 | +0.7% | −202 | −77.6% | −240 | −173 |
Balance sheet
| As of | Equity | Debt | Cash | Investments | Fixed assets | Total assets |
|---|---|---|---|---|---|---|
| Jul 2026 | 241 | 3,186 | 231 | 37.1 | 2,340 | 5,526 |
| Apr 2026 | 552 | 2,950 | 371 | – | 2,371 | 5,686 |
| Jan 2026 | 302 | 2,858 | 385 | – | 2,414 | 5,600 |
| Oct 2025 | 157 | 3,108 | 582 | – | 2,380 | 5,764 |
Cash flow
| Year end | Operating | Investing | Financing | Free cash flow |
|---|---|---|---|---|
| Jul 2026 | 480 | −266 | −421 | 248 |
| Jul 2025 | 555 | −205 | −243 | 320 |
| Jul 2024 | 589 | −241 | −577 | 378 |
| Jul 2023 | 638 | −273 | −914 | 323 |