The Travelers Companies · TRV
Travelers' profit growth now rests on reserve releases and investment income
Without reserve releases, Travelers' core income fell last quarter; the rise in core income per share came from released reserves, investment income and a smaller share count.
Published · Inve Research Desk
The Travelers Companies stock page → More news from Oct 16, 2026

4.8%
fall in core income excluding reserve releases
Calculated from the reported figures: reported core income rose 4.3% despite higher catastrophe losses, but after-tax reserve releases rose by more than the whole increase.
How they did last quarter
Reported earnings beat a year ago, but reserve releases rose by more than the whole increase, and the expense-ratio guide of around 28.5% was raised to a little below 29%.
- Core income$1,947M, up 4.3% on a year agovs $1,762M excluding reserve releases, against $1,851M a year agoReserve releases rose by more than the whole increase; underwriting before catastrophes and releases did not grow.
- Underlying underwriting income$1,386M, down 1.1%vs $1,401M a year agoUnderwriting profit before catastrophes and reserve releases is flat to slightly lower.
- Expense ratio28.9%, against 28.6% a year agovs the July guide of "around 28.5%" for 2026Above the guide, which has now been replaced by a figure a little below 29%.
Reserve releases supplied the rise in Travelers' earnings
Travelers' core income, the profit measure the insurer reports, rose 4.3% in the September 2026 quarter. The reserve release rose by more than the whole increase in core income; higher investment income also helped and higher catastrophe losses offset part of it. When the company decides that claims it set money aside for in earlier years will cost less than expected, it releases the difference into profit, and that release was worth $185 million after tax last quarter against $16 million a year earlier.
Without it, core income was $1,762 million against $1,851 million a year ago, a fall of 4.8%, calculated from the reported figures. Higher catastrophe losses, $424 million after tax against $318 million, explain more than that fall; underlying underwriting income, which excludes both, was nearly unchanged. Core earnings per share still rose, helped by a smaller diluted share count.
Management lists liability and commercial auto as releasing
Pretax favourable development was far larger than a year earlier. Both quarters carry an annual asbestos charge, so the swing is better read through Business Insurance excluding asbestos, where releases more than doubled. The company has released reserves for several quarters running.
What changed is where. Earlier calls tied Business Insurance releases to workers' compensation and, later, commercial property. This time the chief financial officer, Daniel Frey, listed commercial auto, general liability and commercial multi-peril alongside them, and said no single line was outsized. Frey said the company's view of the uncertainty in those long-tail lines had not changed, although better experience had earned some reaction in the picks.
Better claims experience may be the whole explanation, and Travelers said the favourability applied to recent accident years. Still, the first nine months of this year already exceed the whole of last year, calculated from the release and the January call.
Investment income is the line management is guiding up
Management guided a year ahead for fixed-income investment income: "For 2027, we expect more than $3.6 billion" after tax. New money is going in at a yield well above the existing portfolio's, a gap that has widened over the calls shown, and after-tax net investment income grew again last quarter.
The same rise in rates produced a cost. Unrealised investment losses after tax grew sharply, and shareholders' equity was 12% lower than at the previous year-end. Management said the changes have little or no effect on cash flows, statutory surplus or regulatory capital, and Travelers kept buying back stock through the quarter at well above book value per share.
Costs are guided up and price gains keep slowing
The company guided its 2026 expense ratio to about 28.5% on the earlier calls in the window checked. It now expects a figure a little below 29% for this year and about the same for next. Management attributed the rise to profit-sharing and contingent commissions, which climb as underwriting results improve, so part of it is the price of good results.
Pricing is the other side. Business Insurance renewal premium change was 4.1% last quarter, down from 7.1% on the call a year earlier and lower on each call between. Asked about 2027 growth, management declined to give a trend or a number. On property pricing the chief executive, Alan Schnitzer, said "We're not prepared to call the bottom." Asked about loss-cost trend, the chief executive said the loss environment was as expected, with no surprises, but put no figure on it on the call, so whether prices still outrun claims costs cannot be tested here.
Revenue growth, last eight quarters
Revenue growth has faded from 9.9% to a decline of 0.5%, partly because the Canadian business was sold.
Sales YoY, %
- Dec '24 +9.9%
- Mar '25 +5.2%
- Jun '25 +7.4%
- Sep '25 +4.8%
- Dec '25 +3.5%
- Mar '26 +1.0%
- Jun '26 +0.3%
- Sep '26 −0.5%
Returns remain high; 2027 is the open question
Flat underwriting is not weak underwriting. Core return on equity was 24.1% over the last four quarters, well above the year before. Asked whether the underlying underwriting income management has called durable would hold next year, Frey said "we don't know if 2027 is going to be a little higher than that, a little lower than that or flat." With reserve releases, investment income and buybacks carrying the growth, the outlook depends on how long the underwriting base holds.
The Travelers Companies stock page →
The record: notes, full financial tables
Notes
Impact 4/5 Guidance Negative
Travelers' expense-ratio guide moves to just under 29% from 28.5%
Travelers moved its expense-ratio guidance, to just under 29% for 2026 and about the same for 2027. The ratio was 28.9% in the September 2026 quarter against 28.6% a year earlier, and 29.0% for nine months. The company had guided "around 28.5%" on each call from October 2025 to July 2026. Management tied the rise to profit-sharing and contingent commissions, which climb with underwriting profit.
“which we now expect to come in a little below 29% for 2026 and about the same for 2027.”— Daniel Frey, CFO
Impact 4/5 Margin Mixed
Travelers books $234M of reserve releases, up from $22M a year ago
Prior-year reserve development was $234 million favourable before tax in the September 2026 quarter against $22 million a year earlier, across all three segments. Inside it sits a $295 million asbestos charge, against $277 million a year ago, and Business Insurance excluding asbestos was $336 million favourable against $152 million. After tax, development rose $169 million, more than the $80 million rise in core income, while higher catastrophe losses of $424 million after tax against $318 million offset part of it. The chief financial officer named commercial auto and general liability among the lines releasing.
Impact 4/5 Guidance Positive
Travelers guides 2027 fixed-income investment income above $3.6B, about 9% over 2026
After-tax net investment income was $908 million in the September 2026 quarter, up 7% and the first above $900 million. For 2027 management guided fixed-income income above $3.6 billion after tax, rising from about $875 million in the first quarter to about $965 million in the fourth; that is about 9% above 2026's $3.3 billion, calculated from the two guides. Cash invested in the quarter went in roughly 1.2 percentage points above the existing portfolio's yield, against about 0.9 point on the July call.
“For 2027, we expect more than $3.6 billion”— Daniel Frey, CFO
Impact 3/5 Balance sheet Mixed
Travelers' equity is 12% lower than at year-end as unrealised losses rise to $6.4B
Shareholders' equity was $28,995 million at 30 September 2026 against $32,894 million at 31 December 2025, as after-tax unrealised investment losses rose to $6.4 billion from $1.5 billion. Management said such changes have little or no effect on cash flows, statutory surplus or regulatory capital. Debt-to-capital is 25.3% including the losses; excluding them it is 21.7%, within the company's target range of 15% to 25% for that measure. Travelers still repurchased $1.508 billion of stock at an average $376.00 a share; by our calculation that is 2.7x book value per share of $141.48 and 2.2x adjusted book value per share of $172.47, which excludes the unrealised losses.
Impact 3/5 Demand Mixed
Travelers' Business Insurance renewal price gains slow to 4.1% from 7.1% a year ago
Business Insurance renewal premium change was 4.1% in the September 2026 quarter (7.0% excluding property), against 7.1% on the October 2025 call and 4.8% on the July call. Retention held at 86% and new business rose 4% to $699 million. On property pricing, the chief executive said management was not prepared to call the bottom. Asked about 2027 growth in the segment, management declined to give a trend or a number, and also declined to give a combined-ratio outlook by segment.
“We're not prepared to call the bottom.”— Alan Schnitzer, Chairman and CEO
Impact 2/5 Guidance Mixed
Travelers cedes more cyber premium from 1 October, cutting Q4 premiums $165M
Travelers raised the share of its cyber book ceded to reinsurers from 1 October 2026, lowering net written premiums by about $165 million in the fourth quarter and about $230 million in 2027, mostly in Bond & Specialty. Management expects the earnings effect to be de minimis in both years. Bond & Specialty premiums rose 12% to $1,209 million in the September 2026 quarter, so the cession should lower its reported premium growth from the fourth quarter.
“Effective October 1, we increased the percentage ceded to our cyber reinsurance quota share.”— Daniel Frey, CFO
Financials
Income statement, last 8 quarters
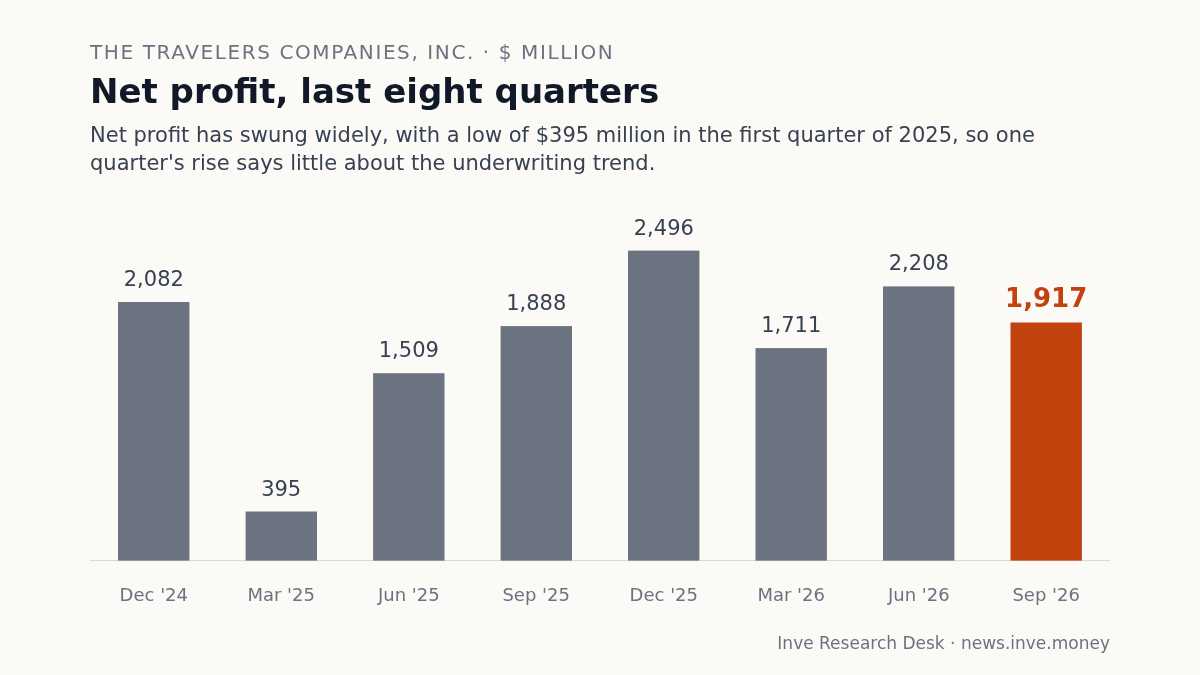
| Quarter end | Sales | YoY | PBT | Net profit |
|---|---|---|---|---|
| Sep 2026 | 12,412 | −0.5% | 2,403 | 1,917 |
| Jun 2026 | 12,153 | +0.3% | 2,767 | 2,208 |
| Mar 2026 | 11,924 | +1.0% | 2,119 | 1,711 |
| Dec 2025 | 12,432 | +3.5% | 3,103 | 2,496 |
| Sep 2025 | 12,470 | +4.8% | 2,344 | 1,888 |
| Jun 2025 | 12,116 | +7.4% | 1,881 | 1,509 |
| Mar 2025 | 11,810 | +5.2% | 468 | 395 |
| Dec 2024 | 12,008 | +9.9% | 2,594 | 2,082 |
Balance sheet
| As of | Equity | Debt | Cash | Total assets |
|---|---|---|---|---|
| Jun 2026 | 33,121 | – | 621 | 143,580 |
| Mar 2026 | 31,986 | – | 615 | 142,309 |
| Dec 2025 | 32,894 | 300 | 842 | 143,708 |
| Sep 2025 | 31,609 | – | 729 | 143,678 |
Cash flow
| Year end | Operating | Investing | Financing |
|---|---|---|---|
| Dec 2025 | 10,606 | −7,652 | −2,663 |
| Dec 2024 | 9,074 | −7,264 | −1,747 |
| Dec 2023 | 7,711 | −6,821 | −1,051 |
| Dec 2022 | 6,465 | −3,728 | −2,669 |