
TD Synnex · SNX
TD SYNNEX beat its forecast again, but nine months of growth consumed $2.24B of cash
Adjusted profit beat the company's guidance again, for the sixth quarter running, yet free cash flow is negative $2.24B for the year so far, borrowing is up, and the January cash goal went unmentioned.
Published · Updated · Inve Research Desk
-$2.24B
free cash flow in the first nine months of fiscal 2026
Against negative $33M a year earlier: nine months of growth have used more cash than the business made, and the company drew down its cash and added borrowing to cover it.
How they did last quarter
Better than the company guided on profit and billings, and well short of the cash performance its January framework implied.
- Adjusted earnings per share$5.68, +58.7% on $3.58 a year agovs Guidance of $4.50 give or take $0.25 (25 June 2026)Above the top of the range and 26% above its midpoint, by our arithmetic.
- Gross billings$31.83B, +40.0% on a year agovs Guidance of $27.7B give or take $0.5B (25 June 2026)Above the top of the range for the sixth quarter running.
- Free cash flowNegative $975.6Mvs Positive $213.9M a year ago; negative $332.4M the quarter beforeThird negative quarter of the year; nine months now total negative $2.24B.
- Operating margin (GAAP)2.98%vs 2.45% a year ago; 2.65% the quarter beforeUp on both, helped by overhead growing far slower than billings.
A quarter that beat guidance, with cash going the other way
TD SYNNEX, the technology distributor, said on 24 September that it had again beaten its own forecast for the August 2026 quarter. Adjusted earnings (the company's own non-GAAP measure) were $5.68 a share against guidance of $4.50. It was the sixth quarter running above the midpoint of that guidance. Profit is not the question. Cash is.
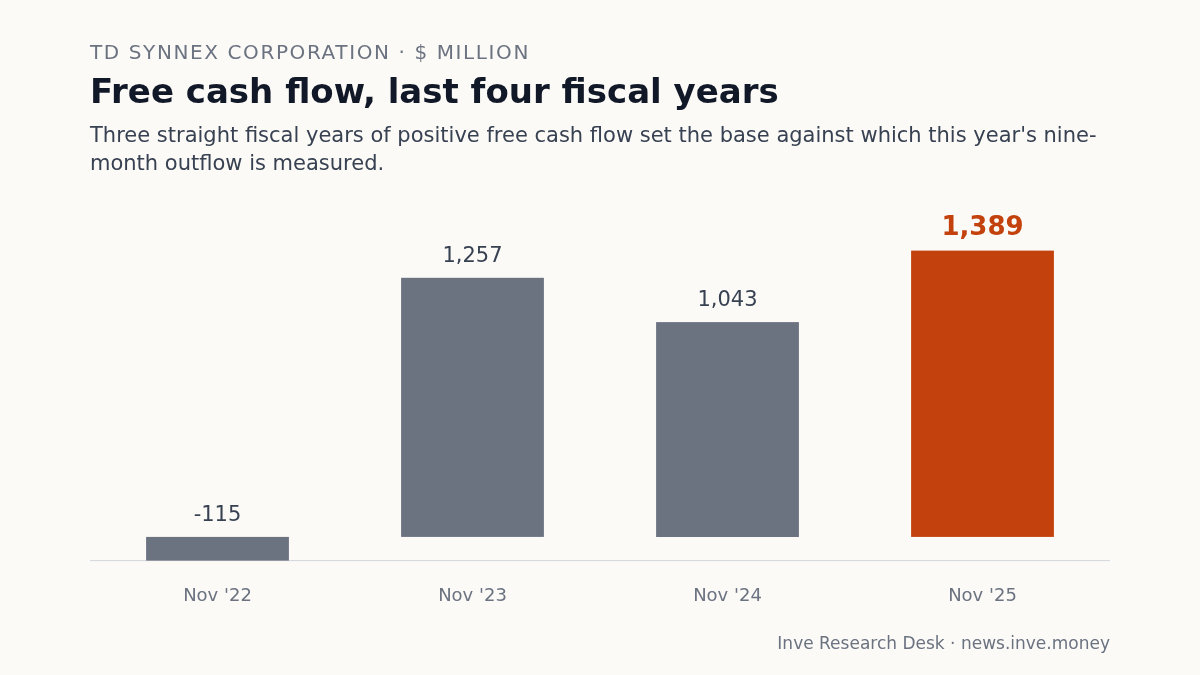
The number a holder is waiting for is free cash flow: what is left after the business pays its running costs and buys its equipment. In the first nine months of the fiscal year it was negative $2.24B, after a positive year before it. A business that grows fast usually needs cash to do it, and this one has needed a great deal.
The January cash goal has gone quiet
On 8 January the chief financial officer said cash generated over the two fiscal years together would be in line with the company's framework of turning 95% of adjusted net income into free cash flow. By our arithmetic the two years together now sit below zero, and the fourth quarter would need to bring in about $3.5B to restore the framework. Last year's fourth quarter, which the company said was helped by timing, was far smaller.
On 25 June, asked whether to recalibrate, the chief financial officer called that ratio the company's long-term guiding measure and warned that fast growth consumes cash, without restating the two-year total. On this call the transcript does not mention it. Management pointed instead to cash coming in during the fourth quarter and better cash conversion at Hyve, its hyperscale data-center business, in the next fiscal year. It gave no ratio, no dollar amount and no target date. The chief financial officer's explanation was this: "FY '26 was a period of hyper growth. But we also front-loaded a lot of working capital investments to enable that."
Cash and borrowing filled the gap; holders were still paid
The cash went into inventory and receivables, which together grew by about $9.0B by our arithmetic, against a $4.8B rise in payables to suppliers. Total borrowings rose to $5.52B over the same period, and cash on hand fell sharply. Long-term borrowing barely moved; the increase is in current borrowings, and the release shows $1.64B of net revolving-credit borrowing over the nine months. Over the same nine months the company also spent about $408M on buybacks and dividends, by our arithmetic, and interest expense last quarter was well above a year ago.
The profit did arrive. Operating margin rose over the year, because overhead costs grew far more slowly than billings. Gross margin on revenue slipped over the same year, so the gain came from cost control, not from earning more on each sale.
Operating margin, last eight quarters
Margin has climbed over the period: the profit improvement is real and is the part of the story that is not in doubt.
Operating margin, %
- Nov '24 2.0%
- Feb '25 2.1%
- May '25 2.2%
- Aug '25 2.5%
- Nov '25 2.3%
- Feb '26 2.9%
- May '26 2.7%
- Aug '26 3.0%
Cash and total assets, recent quarter-ends
Assets grew by billions while cash shrank: the expansion sits in inventory and receivables, funded by supplier payables, cash on hand and borrowing.
$ million
| Cash | Total assets | |
|---|---|---|
| Nov 2025 | 2,435 | 34,251 |
| Feb 2026 | 1,563 | 35,084 |
| May 2026 | 1,094 | 38,506 |
| Aug 2026 | 749 | 41,845 |
What has to go right from here
The company guided fourth-quarter billings level with last quarter. Last year the fourth quarter ran ahead of the third. Hyve billings are guided up, so by our arithmetic distribution's would be flat to lower at the midpoint. One reading is that the guidance is again set low, as it has been for billings in the last six quarters; another is that something in the base is expected to fade.
Hyve's non-GAAP operating margin was 3.61% of its gross billings, well below a year ago. The company says the mix pressure has stabilized, and the new awards are described against today's lower margin, not last year's. Hyve programs can also be cancelled by either side, with financial rights attached; the size of those rights was not given.
There is a further cost in a warrant for Amazon. According to the company's filings, most of its shares vest as payment thresholds are met, and unvested shares reduce revenue as qualifying revenues are recognized. The cash-flow statement shows a first provision of $14.5M. Asked whether it touched the quarter, the chief financial officer said: "I think it's too soon to get into exact specifics on how things played out in the quarter." The size and timing of later charges are not known.
What the next report can settle
The next report will show whether the fourth quarter produced the cash management pointed to, and how much of the inventory built this year has begun to turn back into cash. We do not yet know whether the new Hyve programs ship on the schedule the company gave, or whether its customers will keep their contracts.
Across the calls of 8 January, 25 June and 24 September this company's cash goal went from a two-year expectation, to a long-term aim without the two-year total, to a subject it did not raise. It reported the profit in full and left the cash ratio unsaid.
The record: notes, full financial tables
Notes
Impact 5/5 Balance sheet Negative
TD SYNNEX used $2.24B of cash in nine months; its 95% cash goal went unmentioned
Management said cash should come in during the fourth quarter as working capital normalizes and Hyve's cash conversion improves in fiscal 2027, but gave no ratio, amount or target date. Free cash flow was negative $2.24B in the first nine months of fiscal 2026, against negative $33M a year earlier, and total borrowings rose to $5.52B from $4.61B in November 2025. On 8 January the CFO had tied the two-year total to 95% of adjusted net income; by our arithmetic it is near negative $0.85B, and the ratio was not mentioned this time. On 25 June the CFO called that ratio the company's long-term North Star.
“FY '26 was a period of hyper growth. But we also front-loaded a lot of working capital investments to enable that.”— David Jordan, CFO
Impact 4/5 Guidance Mixed
TD SYNNEX guides fourth-quarter billings flat at $31.9B after six beats of its range
The company guided fourth-quarter gross billings to $31.9B, give or take $0.5B, and adjusted EPS to $5.90, give or take 25 cents. Billings of $31.83B last quarter finished above the top of its $27.2B-$28.2B range given on 25 June, and billings have beaten the guided range in each of the last six quarters. A flat guide compares with a 6.9% sequential rise in the fourth quarter a year ago, and with Hyve billings that are meant to rise, which at the midpoint leaves distribution flat to lower.
“Hyve's non-GAAP gross billings will increase sequentially quarter-over-quarter as we continue to see further benefit from ramping programs across multiple new customers.”— David Jordan, CFO
Impact 4/5 Margin Mixed
Hyve margin is 3.61% against 5.04% a year ago; the company says mix has stabilized
Hyve's non-GAAP operating margin on gross billings was 3.61% last quarter against 5.04% a year ago, a gap of 1.43 percentage points, while its billings rose 117% to $7.0B. The company says the mix pressure has stabilized. The margin is up from 3.3% the quarter before, but below the 4.2% of two quarters earlier, and new pipeline awards are described against today's margin, not last year's. By our arithmetic Hyve supplied 34% of non-GAAP operating income.
“Several opportunities in our pipeline are being awarded at margin profiles that are neutral to accretive relative to our current operating performance.”— Patrick Zammit, CEO
Impact 3/5 Risk Negative
Amazon warrant shows a first $14.5M provision; the CFO would not size its revenue effect
Asked whether the Amazon warrant had affected the quarter's revenue, the CFO declined to give specifics. According to the company's filings, it covers 3,238,066 shares, 3,022,195 of them with an exercise price of $191.10 and vesting as payment thresholds are met, and unvested shares reduce revenue as qualifying revenues are recognized. The cash-flow statement shows a first $14.5M provision for common stock warrants, with none a year earlier. The size and timing of later charges are not known.
“I think it's too soon to get into exact specifics on how things played out in the quarter.”— David Jordan, CFO
Impact 3/5 Risk Negative
Hyve programs can be cancelled by either side while company inventory climbs 61% to $15.3B
Asked whether Hyve business can be cancelled if the market turns, the CFO said it can, with financial rights on both sides, though programs run longer than distribution contracts. Consolidated inventory was $15.29B at the end of August, up 61% from $9.50B in November 2025; the CFO said Hyve's inventory and new programs drove the cash use, while the CEO said shipments to the new customers begin in the fourth quarter, and the 10-Q does not present assets, inventory included, by segment. In the seven earlier calls we hold, from September 2024 to June 2026, cancellation rights were not raised. No backlog figure or size of the financial rights was given.
“Both sides have financial cancellation rights”— David Jordan, CFO
Impact 3/5 Margin Positive
TD SYNNEX turned 88% of its gross-profit gain into operating profit as overhead rose 4.9%
Gross profit rose $295.6M to $1,425.4M, and non-GAAP operating income rose $261.5M, so by our arithmetic 88.5% of the gain reached operating profit. Overhead (SG&A) rose 4.9% while billings rose 40.0%. The CEO said on the call the company had talked about passing on at least half of gross-profit growth, and this is well above that. Gross margin on revenue fell to 6.61% from 7.22%, so the year-on-year profit gain came from costs.
“taking to the bottom line, at least 50% of the GP growth”— Patrick Zammit, CEO
Financials
Income statement, last 8 quarters
| Quarter end | Sales | YoY | Operating profit | Op. margin | PBT | Net profit |
|---|---|---|---|---|---|---|
| Aug 2026 | 21,558 | +37.7% | 643 | 3.0% | 555 | 416 |
| May 2026 | 19,575 | +31.0% | 519 | 2.7% | 430 | 334 |
| Feb 2026 | 17,161 | +18.1% | 489 | 2.9% | 422 | 327 |
| Nov 2025 | 17,379 | +9.7% | 399 | 2.3% | 311 | 248 |
| Aug 2025 | 15,651 | +6.6% | 384 | 2.5% | 293 | 227 |
| May 2025 | 14,946 | +7.2% | 328 | 2.2% | 238 | 185 |
| Feb 2025 | 14,532 | +4.0% | 305 | 2.1% | 215 | 168 |
| Nov 2024 | 15,845 | +10.0% | 325 | 2.0% | 237 | 195 |
Balance sheet
| As of | Equity | Debt | Cash | Fixed assets | Total assets |
|---|---|---|---|---|---|
| Aug 2026 | 9,302 | – | 749 | 565 | 41,845 |
| May 2026 | 8,950 | 1,126 | 1,094 | 540 | 38,506 |
| Feb 2026 | 8,783 | 1,129 | 1,563 | 504 | 35,084 |
| Nov 2025 | 8,450 | 1,018 | 2,435 | 496 | 34,251 |
| Aug 2025 | 8,454 | 1,195 | 874 | 489 | 31,683 |
Cash flow
| Year end | Operating | Investing | Financing | Free cash flow |
|---|---|---|---|---|
| Nov 2025 | 1,532 | −221 | −33 | 1,389 |
| Nov 2024 | 1,218 | −194 | −953 | 1,043 |
| Nov 2023 | 1,407 | −156 | −786 | 1,257 |
| Nov 2022 | −50 | −116 | −276 | −115 |