State Street · STT
State Street's profit is running ahead of plan while its new servicing business trails the goal
State Street's pretax margin was 34.6% in the quarter against a 35% medium-term target, and the 2026 guide implies about 33% for the full year; nine-month servicing sales of $211 million trail the goal of $350 to $400 million.
Published · Inve Research Desk

$211 million
servicing fee sales in the first nine months of 2026
The company targeted $350 million to $400 million for the year; reaching the bottom of that range would need $139 million in the fourth quarter, calculated from the reported sales.
How they did last quarter
Profit came in ahead of the company's earlier guide, while new-business sales trail the goal it set in April and the backlog of won business is smaller than a year ago.
- Servicing fee sales$68 million in the quarter, $211 million for nine monthsvs the April 2026 target of "$350 million to $400 million" for the yearBehind the pace the goal needs; management expects the year above $300 million, the fourth quarter above $100 million, and says it is still driving towards the range.
- Pretax margin34.6% in the quarter, against 31.1% a year agovs the 35% margin level management named in July for the next three to five years0.4 points under that level in the quarter; the 2026 guide implies about 33% for the full year, and management wants the 35% on a full-year basis.
- Revenue$4,004 million, up 12.9% on a year ago and down 1.1% on the quarter beforevs growth of 17.4% on a year ago in the quarter beforeGrowth is easing; the only earlier quarterly fall in the eight quarters shown was in early 2025 ($3,284 million, down from $3,412 million).
Sales of new servicing business trail the goal set in April
State Street earns the largest share of its fees, close to half, by holding and administering assets for institutional clients, and part of the growth that does not depend on markets comes from winning new mandates, alongside existing clients' own growth and activity. The company tracks that as servicing fee sales, the estimated annual revenue from business newly won. In April it still targeted $350 million to $400 million of such sales for the year. Over the first nine months they came to $211 million.
Asked why sales were below that level, the chief financial officer said the fourth quarter should bring more than $100 million, and that the final figure depends on when large deals close. The chief executive said some of those deals could slip into the following quarter. The chief executive said the company still felt good about the range it had given and was driving towards it; the chief financial officer said the year should be the fourth in a row above $300 million. The company's own record gives a yardstick: in 2024 the fourth quarter alone brought $154 million and the year ended at $377 million, inside the range.
The backlog of won business is smaller than a year ago
Sales become revenue only once a client's assets are moved onto State Street's systems. Servicing fee revenue waiting to be installed was $332 million at the end of September, against about $400 million a year earlier, which is lower by our calculation. For 2025 the company reported sales below the same range it had described itself as on track for in October.
A smaller backlog does not by itself show weak selling, because it also falls when installed or dropped mandates leave it faster than new sales arrive; on approximate figures, about $291 million of sales went in over the past four quarters while the backlog fell by about $68 million. Servicing fees themselves are still growing: about 7% organically, with higher market levels supplying the rest of the increase. Measured against period-end assets under custody and administration, those fees were lower than a year ago, calculated from the filed figures.
Profit has run ahead of plan while revenue growth eases
Pretax margin, the share of revenue left before tax, was 34.6% in the September 2026 quarter. In July the company named 35% as its medium-term margin level. Its margin guide for the year has risen at each call, most recently to a level the chief financial officer described in October as implying something closer to 33%. One quarter above that level is not the full-year yardstick: management wants the 35% delivered on a full-year basis, and the guide implies a lower full-year figure. Asked whether anything stood in the way, the chief financial officer said, "We do want to make sure that we deliver that on a full year basis".
Growth in revenue has eased from its peak in the quarter before. Revenue also fell from the quarter before; the only earlier fall in the eight quarters shown in the tables below was in the first quarter of 2025.
Revenue growth on a year ago, last eight quarters
Growth rose from 7.5% in the fourth quarter of 2025 to 17.4% and has now eased to 12.9%, so revenue is growing more slowly than in the spring.
Sales YoY, %
- Dec '24 +12.1%
- Mar '25 +4.7%
- Jun '25 +8.1%
- Sep '25 +8.8%
- Dec '25 +7.5%
- Mar '26 +15.6%
- Jun '26 +17.4%
- Sep '26 +12.9%
Net interest income levelled off and fees dipped
Net interest income, the gap between what State Street earns on its assets and pays on deposits, was little changed from the quarter before, and the net interest margin has slipped since the first quarter. The chief financial officer attributed much of the margin gained over the year to two sources, each worth about five basis points: securities turnover, still adding about one basis point a quarter, and the run-off of terminated hedges, about one more in the fourth quarter. Fee revenue also fell from the quarter before, because FX trading and other fee revenue both fell, partly offset by gains in servicing and management fees.
The outlook assumes global equity markets stay flat from current levels, with rate expectations broadly in line with the forward curve.
The record: notes, full financial tables
Notes
Impact 4/5 Order book Negative
State Street servicing sales are $211M after nine months against a 2026 goal of $350-400M
On 14 October the chief financial officer expected 2026 servicing sales above $300 million, with the fourth quarter above $100 million, and the chief executive said the company is still driving towards the range it has given. Servicing fee sales were $211 million for the first nine months, and the backlog of revenue waiting to be installed was $332 million at 30 September, about 17% below a year earlier (calculated). In April the company still targeted $350 million to $400 million for 2026; in 2024 the fourth quarter alone brought $154 million and the year $377 million.
“we're expecting the fourth year in a row of sales over $300 million”— John Woods, chief financial officer
Impact 4/5 Margin Positive
State Street's pretax margin was 34.6% in the quarter, 0.4 points under its 35% target
Management said on 14 October it wants to deliver the 35% target, set in July for three to five years, on a full-year basis before considering further improvement. Pretax margin was 34.6% in the September 2026 quarter, against 34.3% the quarter before and 31.1% a year earlier. The 2026 margin guide was about 30% in January and 32% in July; the chief financial officer described what the updated guide implies as about 31% in April and about 33% in October.
“We do want to make sure that we deliver that on a full year basis”— John Woods, chief financial officer
Impact 3/5 Margin Mixed
State Street lifts its NII growth guide to 15-16% as quarterly income barely rises
The company raised its full-year net interest income growth guide to 15-16% from 14-15% in July. Quarterly net interest income was $864 million in the September 2026 quarter, against $860 million the quarter before and $835 million in the first quarter, and the net interest margin eased from 1.16% to 1.12%. The chief financial officer expects another sequential rise in the fourth quarter.
“I think the fourth quarter would be another quarter of NII growth versus from a sequential perspective”— John Woods, chief financial officer
Impact 3/5 Guidance Mixed
State Street fee revenue fell 1.5% on the quarter; 13-14% fee guide affirmed 14 October
Fee revenue was $3,140 million in the September 2026 quarter, up 11% on a year ago but down 1.5% on the quarter before, as other fee revenue fell to $98 million from $138 million on late-quarter market adjustments and FX trading fell $67 million. The full-year fee growth guide is 13-14%, against 12-13% at the July call; the chief financial officer said the new range was given in September and affirmed on the call. The chief financial officer said that without late-September market marks, fee growth on a year ago would have been about 12%, in line with what the company expected.
“our fee revenues would have come in around 12%, which would have been right on top of what we were expecting for 3Q”— John Woods, chief financial officer
Impact 3/5 Balance sheet Mixed
State Street's payout guide now reads "approaching 80%" and Q4 buybacks near $700M
The chief financial officer said fourth-quarter buybacks would be about $700 million, against $400 million in the September 2026 quarter, to line up with the payout guide, now worded "approaching 80%". The company had said roughly 80% at the January, April and July calls, and year-to-date payout is about 70%. The CET1 capital ratio was 11.0%, up from 10.8% the quarter before.
“the number is probably closer to $700 million, plus or minus”— John Woods, chief financial officer
Impact 2/5 Demand Mixed
State Street FX revenue fell 14% on the quarter; client volumes were up 31% on a year ago
FX trading revenue was $427 million in the September 2026 quarter, against $494 million the quarter before and $364 million a year ago. Client FX volumes were 31% above a year ago, so revenue per unit of volume fell about 10% on a year ago (calculated; a rough measure, as currency mix differs). The chief executive said record volatility in parts of Asia-Pacific in the second quarter had begun to normalise, and the release cites a lower mix of emerging-market revenue.
“I would urge you to focus on the volume number”— Ronald O’Hanley, chief executive
Financials
Income statement, last 8 quarters
| Quarter end | Sales | YoY | PBT | Net profit |
|---|---|---|---|---|
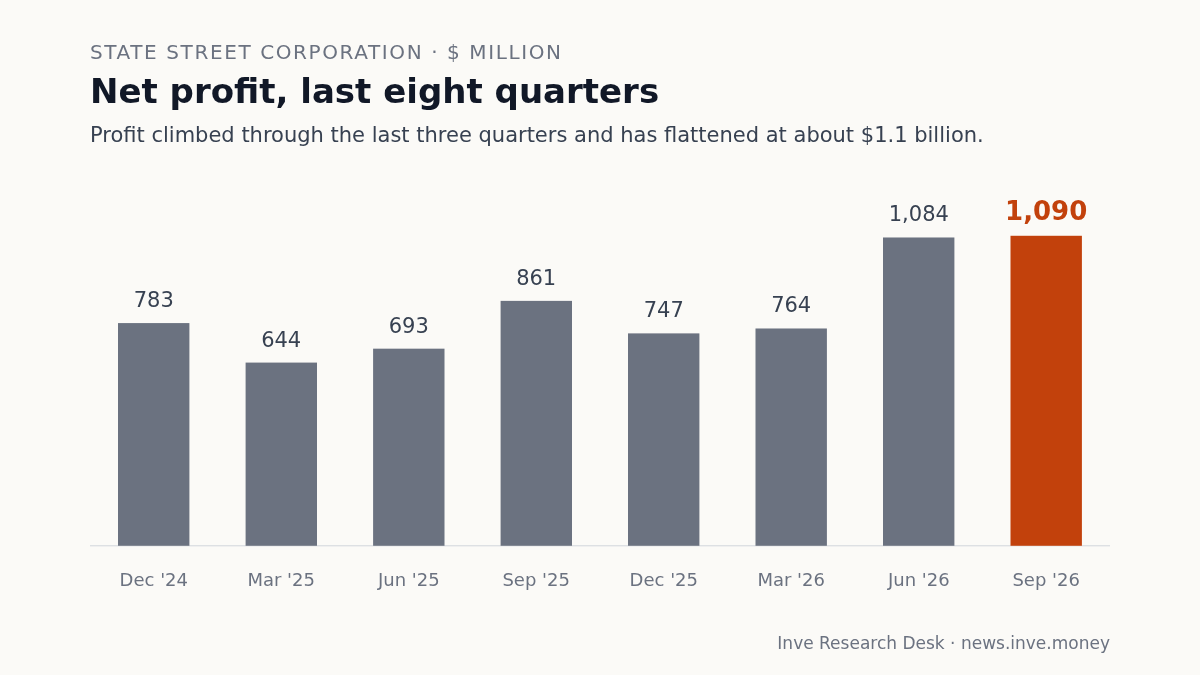
| Sep 2026 | 4,004 | +12.9% | – | 1,090 |
| Jun 2026 | 4,048 | +17.4% | 1,389 | 1,084 |
| Mar 2026 | 3,796 | +15.6% | 969 | 764 |
| Dec 2025 | 3,667 | +7.5% | 918 | 747 |
| Sep 2025 | 3,545 | +8.8% | 1,102 | 861 |
| Jun 2025 | 3,448 | +8.1% | 889 | 693 |
| Mar 2025 | 3,284 | +4.7% | 822 | 644 |
| Dec 2024 | 3,412 | +12.1% | 960 | 783 |
Balance sheet
| As of | Equity | Cash | Fixed assets | Total assets |
|---|---|---|---|---|
| Jun 2026 | 28,268 | 4,290 | 3,854 | 418,381 |
| Mar 2026 | 27,742 | 6,518 | 3,313 | 392,165 |
| Dec 2025 | 27,841 | 4,433 | 3,174 | 366,047 |
| Sep 2025 | 27,642 | 4,756 | 3,080 | 371,070 |
Cash flow
| Year end | Operating | Investing | Financing | Free cash flow |
|---|---|---|---|---|
| Dec 2025 | 11,898 | −12,991 | 2,381 | 10,843 |
| Dec 2024 | −13,210 | −39,483 | 51,791 | −14,136 |
| Dec 2023 | 690 | 12,738 | −13,351 | −126 |
| Dec 2022 | 11,954 | 6,816 | −18,431 | 11,220 |