Southern Copper · SCCO
Southern Copper's record profit came from price as Tia Maria's start slipped to 2028
Southern Copper earned a record on higher copper prices while selling slightly less copper, and its Tia Maria plant, the larger of the two mines it is building, now starts in the first half of 2028.
Published · Inve Research Desk
Southern Copper's net sales rose 39.1% in the September 2026 quarter to a record, and net income also set a record. The tonnage did not come with it. The company sold 0.4% less copper than a year earlier, while the London Metal Exchange copper price averaged 44.4% more. The profit came from price, and the plant meant to add the next tonnes is now due to start later than management said in July.
Sales rose with the copper price while the copper sold slipped
%
- LME copper price 44.4%
- Net sales 39.1%
- Copper sales volume -0.4%
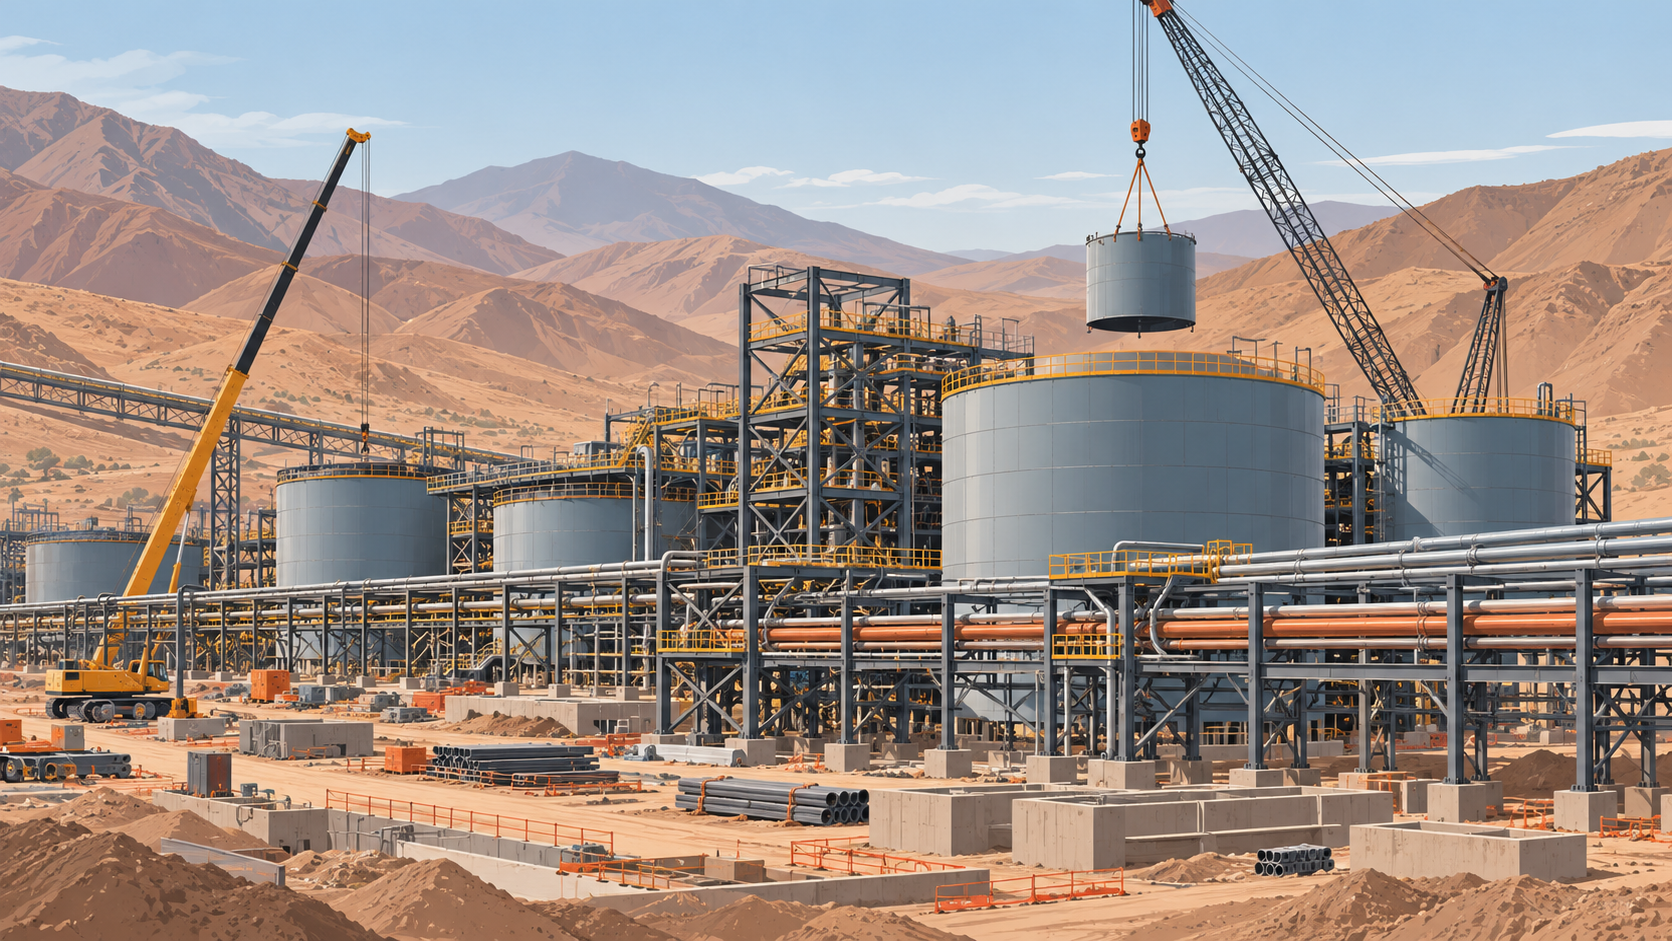
The growth story management tells holders rests on new mines in Peru and Mexico, and the first is Tia Maria in Arequipa, Peru. It is an SX-EW plant, which leaches copper from the ore and recovers it as cathodes, and it is rated at 120,000 tonnes a year in its early years. Its start has drifted. In July 2025 management expected tests and some production in the first half of 2027. In January it put first output in the second half of that year, and in July it pointed to the later part of the year. The results now say operations begin in the first half of 2028.
Raul Jacob, the chief financial officer, said assembling the equipment mechanically, along with some engineering work, was taking longer than planned. The plant was 49.6% complete at the end of September, with $884.3 million invested against a budget that stood at $1.8 billion on the July call. Asked whether the later date would raise that cost, he said the company was reporting no change and would take up the budget in its January call, together with next year's production forecast and spending.
The later start also loosens the production path. In January and again in July, management put 2028 output at about 970,000 tonnes, and the January figure assumed a full year of Tia Maria. A plant that starts some time in the first half of that year cannot supply a full year. The company said a firmer forecast for next year will follow a review of all its mine plans.
The price gains also flatter cost. Cash cost per pound before by-product credits, the measure the company says it uses to monitor its cost structure, was 245.5 cents last quarter, higher than in the same quarter a year earlier. By-product sales, from molybdenum, silver, zinc and sulfuric acid, now cover 96.1% of that cost, up from 81.1%, calculated from the company's cost table. That is how it reports a net cash cost of $0.09 a pound, a figure that will move with by-product prices as much as with anything done at the mines.
By-product sales now cover nearly all of the gross cash cost of each pound of copper
%
By-product credits as a share of cash cost before credits
- 81.1% Q3 2025
- 96.1% Q3 2026
Money is not what holds Tia Maria back. At the end of September cash and short-term investments exceeded long-term debt, leaving net cash of $67.0 million, calculated from the balance sheet with leases excluded. The company also has another lever it is evaluating: a $680 million expansion at Cuajone, which the company says would produce an average of 55,000 tonnes of copper a year and is meant to maintain or potentially increase the mine's output. The January call is where management has said it will give next year's forecast and address Tia Maria's budget.
The record: full financial tables
Financials
Income statement, last 8 quarters
| Quarter end | Sales | YoY | Operating profit | Op. margin | PBT |
|---|---|---|---|---|---|
| Jun 2026 | 4,289 | +40.6% | 2,623 | 61.2% | 2,599 |
| Mar 2026 | 4,251 | +36.2% | 2,480 | 58.3% | 2,444 |
| Dec 2025 | 3,870 | +39.0% | 2,110 | 54.5% | 2,038 |
| Sep 2025 | 3,377 | +15.2% | 1,769 | 52.4% | 1,724 |
| Jun 2025 | 3,051 | −2.2% | 1,587 | 52.0% | 1,544 |
| Mar 2025 | 3,122 | +20.1% | 1,536 | 49.2% | 1,479 |
| Dec 2024 | 2,784 | +21.3% | 1,307 | 47.0% | 1,245 |
| Sep 2024 | 2,931 | +17.0% | 1,450 | 49.5% | 1,427 |
Balance sheet
| As of | Equity | Debt | Cash | Investments | Fixed assets | Total assets |
|---|---|---|---|---|---|---|
| Jun 2026 | 12,632 | 7,994 | 5,665 | 1,665 | 10,662 | 24,128 |
| Mar 2026 | 11,788 | 6,752 | 4,915 | 434 | 10,468 | 21,930 |
| Dec 2025 | 11,038 | 6,751 | 4,305 | 605 | 10,272 | 21,381 |
| Sep 2025 | 10,450 | 6,749 | 3,950 | 576 | 10,002 | 20,332 |
Cash flow
| Year end | Operating | Investing | Financing | Free cash flow |
|---|---|---|---|---|
| Dec 2025 | 4,752 | −1,685 | −2,007 | 3,427 |
| Dec 2024 | 4,422 | −673 | −1,645 | 3,394 |
| Dec 2023 | 3,573 | −1,398 | −3,101 | 2,565 |
| Dec 2022 | 2,803 | −667 | −3,011 | 1,854 |