Simon Property Group · SPG
Simon's third raise of 2026 leaves room for only about 1% growth in the fourth quarter
Simon Property Group lifted its 2026 FFO guidance again, but the new range implies little fourth-quarter growth, and management expects next year's interest bill to weigh about as much as this year's.
3 min read Published on

Published by
Inve Content team
Simon Property Group stock page → More news from Nov 10, 2026
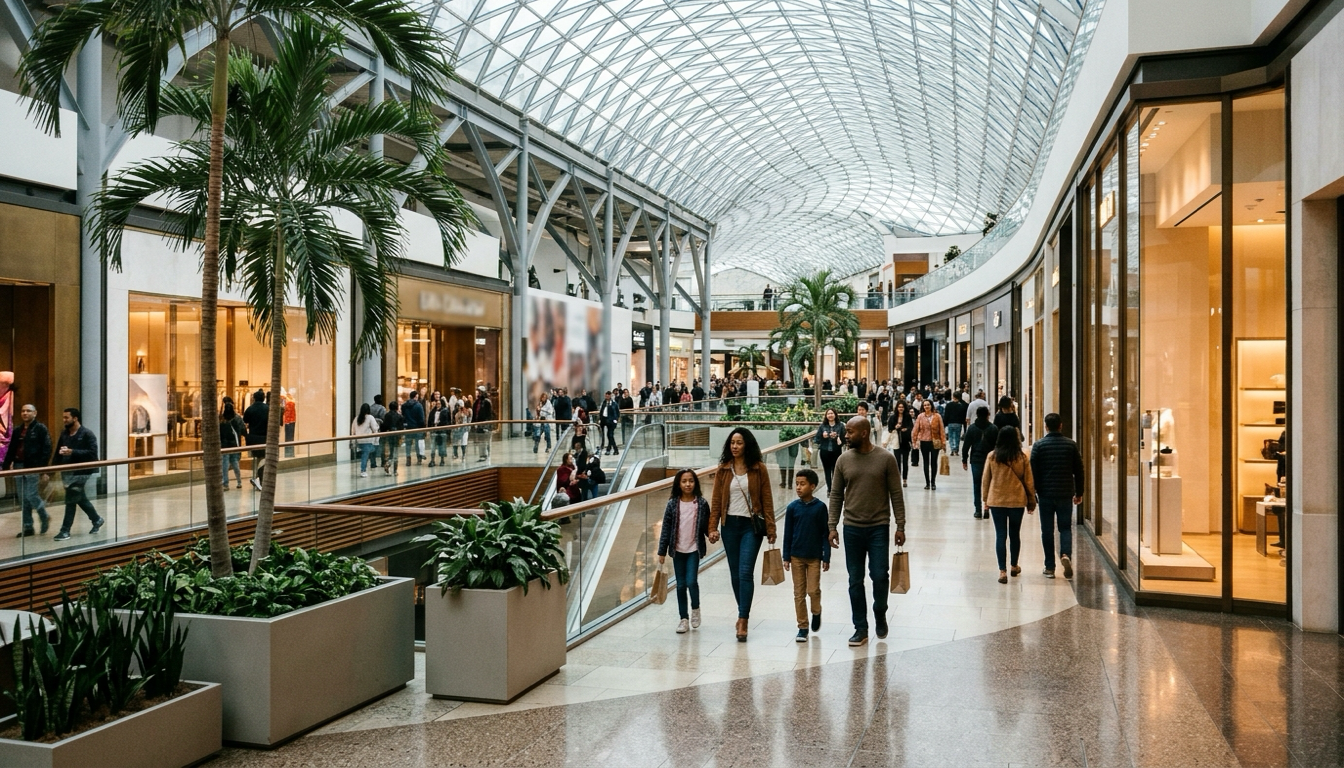
Simon Property Group, which owns shopping malls and outlet centres across the US, has again lifted its 2026 guidance for Real Estate FFO, the per-share earnings measure REITs use, which adds back property depreciation and leaves out investment gains and losses. It was the third raise this year: the range set in February at $13.00-$13.25 went to $13.10-$13.25 in May, $13.20-$13.30 in August and now $13.30-$13.40. Set against what the company has already earned, though, the new range leaves the fourth quarter with very little growth.
Simon does not guide single quarters, so the sum is ours. Taking the nine-month result from the midpoint of the annual range leaves about $3.53 a share for the fourth quarter. Last year's fourth quarter, worked out the same way from the reported full-year and nine-month figures, was about $3.49. That is growth of roughly 1.1% at the midpoint, well below the pace of the third quarter and of the nine months. At the bottom of the range, the fourth quarter would come in slightly below a year earlier. Both inputs are rounded per-share numbers, so the result is approximate.
Simon's raised range implies fourth-quarter growth well below the pace of the year so far
%
- Nine months, reported 6.3%
- Third quarter, reported 4.7%
- Fourth quarter, top of range 2.58%
- Fourth quarter, midpoint 1.15%
- Fourth quarter, bottom of range -0.29%
One reading is that this is the company's habit. In November 2025 Simon guided that year's result to a range it then beat, finishing above the top end. This February it assumed domestic property net operating income, the rent and fees its centres earn after running costs, would grow at least 3%; over the first nine months it grew more than twice as fast. A company that starts low and raises as the year goes on can leave a soft-looking last quarter in its range without expecting one.
The other reading is about the Taubman deal. Simon's earlier part-ownership of Taubman Realty Group, the owner of a set of upscale malls, ended in a transaction at the end of October 2025, and Taubman's centres have been in Simon's own accounts since. Their rent now counts in Simon's revenue, which rose sharply last quarter. Because Taubman was already counted for two of the three months of last year's fourth quarter, the purchase adds much less to year-on-year growth from here. Some of the slowdown inside the range is simply the deal lapping itself.
The same deal explains the weakest-looking figure in the tables below. Operating margin, which is measured after depreciation, was 44.3% in the September 2026 quarter, well below a year earlier, and the drop arrived in the first quarter of this year, the first full quarter with Taubman inside. Owning the buildings outright means carrying their depreciation, and last quarter also carried a one-time catch-up in depreciation from finalising the purchase accounting. Real Estate FFO adds depreciation back, which is how it rose while operating profit fell. Net income fell too, partly because of non-cash losses on the Klépierre exchangeable bonds and a revalued shareholding.
Simon's operating margin stepped down when Taubman arrived and has stayed lower since
%
Operating margin
- 50.8% Q3 2025
- 49.7% Q4 2025
- 43.4% Q1 2026
- 46.0% Q2 2026
- 44.3% Q3 2026
Next year's growth has to clear the cost of borrowing. Management expects the interest bill to weigh on next year about as much as it did this year: it "will probably be in that similar $0.30-ish range of headwinds next year," Eli Simon said, adding that the estimate is volatile. In February the company had guided a rise of similar size for this year.
Filling empty space will not do much of the work. Occupancy at the US malls and outlets was 96.5% at the end of September, barely changed from a year earlier. Base rent per square foot rose 6.1% over the same year, and rent is where the growth now has to come from. Management said it would give guidance for next year in February, alongside the fourth-quarter result that will show whether this year's range was cautious again.
Simon Property Group stock page →
The record: full financial tables
Financials
Income statement, last 8 quarters
| Quarter end | Sales | YoY | Operating profit | Op. margin |
|---|---|---|---|---|
| Sep 2026 | 1,815 | +13.3% | 804 | 44.3% |
| Jun 2026 | 1,791 | +19.5% | 824 | 46.0% |
| Mar 2026 | 1,757 | +19.3% | 762 | 43.4% |
| Dec 2025 | 1,792 | +13.2% | 891 | 49.7% |
| Sep 2025 | 1,602 | +8.2% | 813 | 50.8% |
| Jun 2025 | 1,499 | +2.8% | 744 | 49.7% |
| Mar 2025 | 1,473 | +2.1% | 728 | 49.4% |
| Dec 2024 | 1,582 | +3.6% | 836 | 52.8% |
Balance sheet
| As of | Equity | Debt | Cash | Total assets |
|---|---|---|---|---|
| Sep 2026 | 4,085 | 28,424 | 570 | 39,075 |
| Jun 2026 | 4,434 | 28,700 | 1,019 | 39,709 |
| Mar 2026 | 4,859 | 28,248 | 543 | 39,639 |
| Dec 2025 | 5,208 | 28,430 | 823 | 40,607 |
Cash flow
| Year end | Operating | Investing | Financing | Free cash flow |
|---|---|---|---|---|
| Dec 2025 | 4,137 | −1,601 | −3,113 | 3,202 |
| Dec 2024 | 3,815 | 1,408 | −4,992 | 3,059 |
| Dec 2023 | 3,931 | −1,363 | −2,020 | 3,138 |
| Dec 2022 | 3,767 | −627 | −3,052 | 3,117 |