
Paychex · PAYX
Paychex held its revenue guidance, but the second half must now grow about 6%
Paychex kept its 5% to 6% revenue guidance while raising one segment and warning on another, leaving the year resting on a faster second half and on cash flow that fell sharply.
Published · Updated · Inve Research Desk

6.0%
second-half growth needed for the guidance midpoint
The first half is heading for about 4.9% as reported, so the year needs the second half to return to about the first-quarter pace of 5.9%.2
How they did last quarter
Revenue and adjusted margin landed inside what Paychex had guided, but Management Solutions came in under its guided range and operating cash flow fell from a year ago.
Revenue growth $1,630.5 million, +5.9% on a year ago
vs FY27 guidance of 5% to 6%, set on 24 June 2026 Inside the range and near the top of it.1Operating margin 38.0%, up from 35.2% a year ago
vs Expenses grew 1.3% while sales grew 5.9% Cost restraint did much of the work, though part of the gain is smaller acquisition-related costs.3Management Solutions growth +4.3% on a year ago
vs Its own FY27 range of 5% to 6% Under the floor of its range in the first quarter of the year.10Operating cash flow $413.5 million, down 42.4%
vs $718.4 million a year ago Earnings rose while the cash they produced fell; management calls it timing.4The headline held; the parts under it moved
Paychex left its full-year revenue guidance at 5% to 6% when it reported the August 2026 quarter1. Under that unchanged range, two things shifted and a third was restated. The PEO and Insurance line, where Paychex acts as co-employer for small firms' payroll and benefits, was raised11. Management Solutions, the software-and-services segment, could trend toward the low end of its range if PEO strength continues11. And management restated that enterprise growth, the business that came with the Paycor purchase, is at the pace of its peers16.
Our point is a narrow one. A range that stays put is not the same as a range that is safe, and this one now rests on the second half of the year.
The second half has to grow faster than the first
Sales grew 5.9% last quarter1. Management guided the next quarter to about 4%, in part because a year earlier it booked a couple of one-time gains10. Management says that without those two items the quarter would grow at about the first-quarter rate11. On our arithmetic, the guide puts the first half near 4.9%. To finish the year at the middle of the range, the second half must grow about 6.0%2.
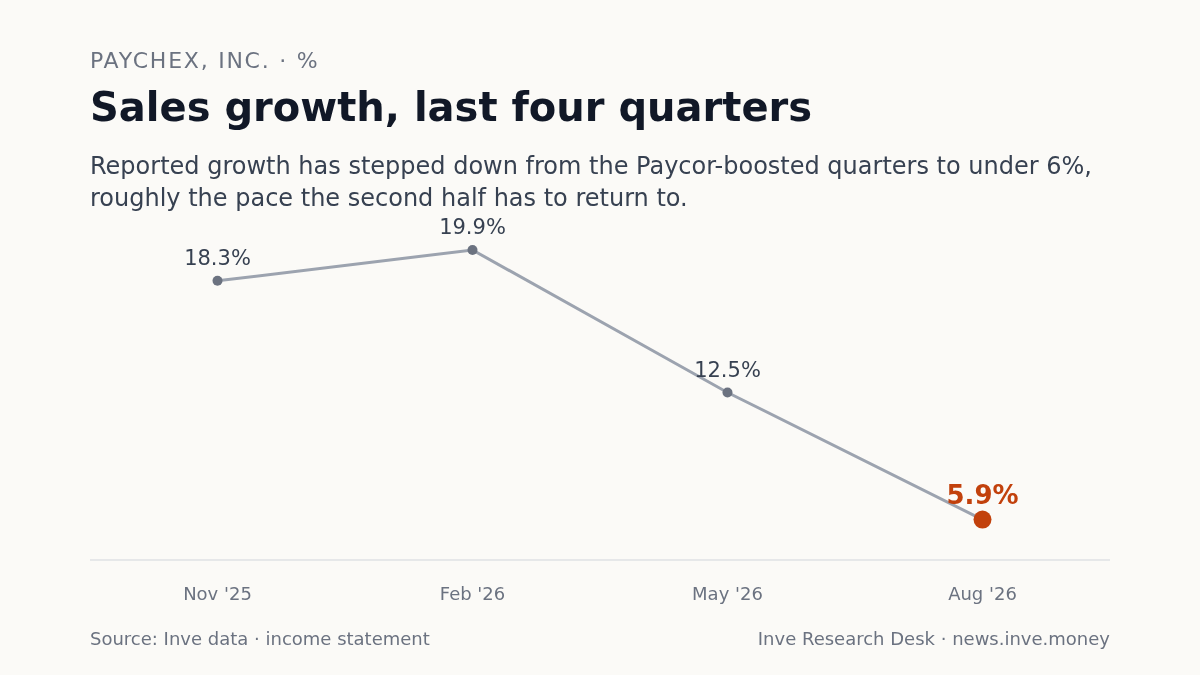
The chief financial officer said the back half needs growth in line with the last two quarters11. Whether that pace holds is the open question, with Management Solutions under its floor and PEO comparisons getting harder. The exhibit shows reported growth stepping down from the Paycor-boosted quarters.
Sales growth, last four quarters
Reported growth has stepped down from the Paycor-boosted quarters to under 6%, roughly the pace the second half has to return to.
Sales YoY, %
- Nov '25 +18.3%
- Feb '26 +19.9%
- May '26 +12.5%
- Aug '26 +5.9%
A low-end warning last year, and one segment hit the floor
Paychex's record is worth setting beside the guidance. On Paychex's own guidance record, six of the seven quarterly total-revenue guides since the first quarter of FY25 were met; the seventh, given while the Paycor purchase was pending, could not be tested7. Full-year segment ranges have gone differently: in December 2025 it warned of the low end, and Management Solutions finished the year at the floor of its range12.
This year the caution came a quarter earlier, and the segment grew 4.3% in the first quarter against a full-year floor of 5%10.
A 12% PEO number that management would not take apart
PEO and Insurance revenue rose 12%, but worksite employees, the count that drives it, grew just shy of double digits9. Management points to insurance volume in Florida, where premiums count as revenue, for part of the gap. That is lower-margin revenue, and management declined to say how much of the growth it is.
Margin held anyway: 38.0%, up from 35.2%3. Roughly half of that gain is a smaller gap between reported and adjusted results, meaning fewer acquisition-related costs13, and the company guided the next quarter's adjusted margin down to about 40%, which it ties to two one-time gains a year earlier11. Sales representatives are paid commission on PEO referrals14. That is not improper, but it is an incentive an owner should know about.
Operating margin, last eight quarters
Margin is up on a year ago; the seasonal high comes in the third quarter.
Operating margin, %
- Nov '24 40.9%
- Feb '25 45.8%
- May '25 30.2%
- Aug '25 35.2%
- Nov '25 36.7%
- Feb '26 43.8%
- May '26 37.7%
- Aug '26 38.0%
Profit rose; the cash from it did not
Operating cash flow fell 42.4% to $413.5 million, and free cash flow of $357.4 million was less than the $424 million paid in dividends4,15. Cash produced was under a hundred percent of net profit for the first time in six quarters8.
Management blamed the timing of client and corporate tax payments and gave no size. That may be right. We cannot test it, and the year-ago base may itself have been unusually high. The second quarter will tell us, along with the October and January health-plan enrollments and the update management said it would give after that quarter.
Second-quarter cash flow and the two enrollments will show whether this year is on track.
Sources
- 1. Sales, August 2026 quarter · $1,630.5 million, +5.9% on $1,540.0 million a year earlier · Q1 FY27 · Inve data · income statement
- 2. Second-half growth needed (Inve arithmetic) · Q2 at about 4% gives first half about 4.9%; second half must grow 5.1% / 6.0% / 7.0% for a 5.0% / 5.5% / 6.0% year (midpoint 6.0%) · H1/H2 FY27 · Inve data · income statement
- 3. Operating margin · 38.0% vs 35.2% a year earlier; expenses $1,011.3 million vs $998.1 million (+1.3%) on sales +5.9% · Q1 FY27 · Inve data · income statement
- 4. Operating cash flow and free cash flow · Operating cash flow $413.5 million vs $718.4 million (-42.4%); free cash flow $357.4 million vs $662.5 million · Q1 FY27 · Inve data · cash flow
- 5. Cash and debt · Cash $600.9 million vs $1,088.2 million at 2026-05-31; debt $4,558.0 million; equity $3,705.5 million · Aug-2026 · Inve data · balance sheet
- 6. Paycor enterprise growth guidance record · Double-digit (30 Sep 2025), revised down 19 Dec 2025 to high single-digit, then diluted; verdict diluted · FY26 · Inve Guidance Tracker
- 7. Quarterly revenue guides · 6 of 7 quarterly total-revenue guides achieved; the seventh (Q4 FY25, given while the Paycor purchase was pending) unverifiable · FY25 Q1 to FY26 Q4 · Inve Guidance Tracker
- 8. Operating cash flow to net profit · 96% in Q1 FY27 vs 187% in Q1 FY26; 138% and 145% in the two quarters before · Q1 FY27 · Inve data · income statement
- 9. PEO and Insurance revenue vs worksite employees · PEO and Insurance revenue $368 million, +12%; worksite employee growth 'just shy of double digits' · call 2026-09-23 · the company's results call
- 10. Management Solutions growth and Q2 guide · Management Solutions +4.3%, slightly below expectations; Q2 revenue growth about 4%, adjusted operating margin about 40% · call 2026-09-23 · the company's results call
- 11. FY27 segment guidance and Q2 items · PEO and Insurance raised to 7% to 8% from 6% to 7% (24 June 2026); Management Solutions could trend to the low end if PEO strength continues; Q2 growth ex two one-time items about the Q1 rate; two one-time gains a year earlier explain the lower Q2 adjusted margin; back half needs growth in line with the last two quarters · call 2026-09-23 · the company's results call
- 12. FY26 segment landings vs guidance · Management Solutions +20% (guide 20% to 22%); PEO and Insurance +7% (guide 6% to 8%); total +17% (guide 16.5% to 18.5%); December 2025 warning covered all three · FY26 · Inve Guidance Tracker
- 13. Adjusted operating margin, Q1 FY27 vs Q1 FY26 · Adjusted operating margin about 42% in Q1 FY27 (+130 bps) vs 40.7% in Q1 FY26; guided 41% to 42% (call 2026-06-24), delivered about 42%; GAAP 38.0% vs 35.2%; gap 4.0 vs 5.5 points, so about 1.5 of the 2.8 points GAAP gain (Inve arithmetic on rounded figures) · call 2026-09-23; call 2025-09-30; call 2026-06-24 · the company's results call
- 14. Sales representatives paid on PEO referrals · CFO said reps can refer PEO prospects and get paid commissions on it · call 2026-09-23 · the company's results call
- 15. Dividends returned in the quarter · Dividends $424 million returned in the quarter · call 2026-09-23 · the company's results call
- 16. Enterprise growth outlook · Enterprise: expected to grow in line with peers, high single-digit range; Q1 enterprise growth high single digits, in line with Q4; bookings up double digits · call 2026-09-23 · the company's results call
The record: notes, full financial tables, guidance history
Notes
Impact 4/5 Guidance Mixed
Paychex holds 5% to 6% revenue guidance; second half needs about 6% for the midpoint
Paychex reaffirmed FY27 revenue growth of 5% to 6% on 23 September, raised PEO and Insurance to 7% to 8% from 6% to 7%, and said Management Solutions could trend to the low end if PEO strength continues. Q2 is guided to about 4%; management says two one-time items a year ago account for the low guide. On our arithmetic the first half runs near 4.9%, so the second half needs about 6.0% to reach the midpoint.
Sources (4)
Claim Value Period From Sales growth Q1 +5.9% to $1,630.5 million Q1 FY27 Inve data · income statement Second-half growth needed About 6.0% at the midpoint vs first half about 4.9% (Inve arithmetic) H1/H2 FY27 Inve data · income statement FY27 guidance by segment Total 5% to 6%; PEO and Insurance 7% to 8% (from 6% to 7% on 24 June 2026); Management Solutions could trend to the low end if PEO strength continues; Q2 about 4%, two one-time items a year ago call 2026-09-23 the company's results call Quarterly revenue guides 6 of 7 achieved; Q4 FY25 unverifiable FY25 Q1 to FY26 Q4 Inve Guidance Tracker Impact 3/5 Risk Mixed
Paychex PEO revenue grew 12%, but management would not size the insurance pass-through
PEO and Insurance revenue rose 12% to $368 million, while worksite employees grew just under 10%. The CFO declined to size how much is lower-margin insurance revenue. PEO is about 23% of Q1 sales but about 43% of the year-on-year increase, on our arithmetic. Worksite growth was mid-single-digit at the 30 September 2025 call and high single-digit by March 2026.
“the worksite employee growth is really what drives PEO revenue, and that is high single digits, just shy of double digits”— Robert Schrader, CFO
Sources (5)
Claim Value Period From PEO and Insurance revenue $368 million, +12%; worksite employees just shy of double digits call 2026-09-23 the company's results call Q1 sales $1,630.5 million Q1 FY27 Inve data · income statement PEO worksite growth wording by call Mid-single-digit (Sep 2025), high single-digit (Mar and Jun 2026), just shy of double digits (Sep 2026) 5 calls Inve call summaries PEO share of sales increase (Inve arithmetic) PEO 368 - 368/1.12 = $39.4 million; 39.4 / (1,630.5 - 1,540.0 = 90.5) = about 43% (42% to 45% across rounding of the 12%) Q1 FY27 Inve data · income statement Analyst question on PEO mix Analyst Mark Marcon asked to quantify the ASO-to-PEO shift and non-pass-through lift; CFO declined call 2026-09-23 the company's results call Impact 3/5 Margin Mixed
Paychex margin rises to 38.0% from 35.2%; Q2 guided lower on two year-ago one-time gains
Operating margin rose to 38.0% in the August 2026 quarter from 35.2% a year earlier, with expenses up 1.3% on sales up 5.9%. About half the GAAP gain is a smaller gap to adjusted results, meaning lower acquisition-related costs; adjusted margin was about 42%. Q2 adjusted margin is guided to about 40% against 41.7% a year ago, and management ties the lower Q2 to two one-time gains a year earlier. The CEO said AI investment this year is five times last year's and that the company is in the investment phase.
“our investment in AI in this fiscal year over the last fiscal year is 5x.”— John Gibson, CEO
Sources (4)
Claim Value Period From Operating margin 38.0% vs 35.2%; expenses +1.3% on sales +5.9% Q1 FY27 Inve data · income statement Adjusted margin and Q2 guide Adjusted about 42%; Q2 about 40% (call 2026-09-23) vs 41.7% a year ago (call 2025-12-19); lower Q2 tied to two one-time high-margin items in Q2 FY26 (revenue-synergy benefit, realized portfolio gains); Q1 FY26 adjusted 40.7% (call 2025-09-30) vs GAAP 35.2%; Q1 FY27 about 42% vs 38.0%; gap 5.5 to 4.0 points (Inve arithmetic) call 2026-09-23; call 2025-12-19; call 2025-09-30 the company's results call Other income and profit Other income $10.9 million vs $23.8 million; EPS $1.21 vs $1.06 Q1 FY27 Inve data · income statement AI investment AI investment this year is 5x last year; company in the investment phase call 2026-09-23 the company's results call Impact 3/5 Balance sheet Negative
Paychex operating cash flow falls 42% to $413.5 million; dividends exceed free cash flow
Operating cash flow was $413.5 million against $718.4 million a year earlier, and free cash flow of $357.4 million trailed the $424 million dividend. Cash produced was 96% of net profit, the lowest of the last six quarters, but the year-ago 187% was an unusually high base (Q4 FY26 138%, Q3 145%, Q2 113%), so the fall looks larger against it. Management called it tax-payment timing and gave no size; Q2 is the test.
“Cash flow from operations were $414 million and were impacted by the timing of client and corporate tax payments.”— Robert Schrader, CFO
Sources (3)
Claim Value Period From Operating cash flow and free cash flow $413.5 million vs $718.4 million; free cash flow $357.4 million Q1 FY27 Inve data · cash flow Cash conversion 96% of net profit vs 187% a year earlier (Q1 FY26); Q4 FY26 138%, Q3 145%, Q2 113% Q1 FY27 Inve data · income statement Dividends paid $424 million call 2026-09-23 the company's results call Impact 2/5 Guidance Positive
Paychex lifts FY27 interest-on-funds guidance to $200 million to $210 million
Paychex raised guidance for FY27 interest on client funds by $5 million at both ends, to $200 million to $210 million, after a 25 basis point Fed rate rise. It had guided $195 million to $205 million on 24 June 2026. Q1 interest was $50 million, up 5%; the guide implies $150 million to $160 million for the rest of the year, against $163 million in the same three quarters of FY26, so flat to lower; the year-ago base includes one-time realized gains in the second quarter.
“Interest on funds held for clients is now expected to be in the range of $200 million to $210 million”— Robert Schrader, CFO
Sources (2)
Claim Value Period From FY27 interest on funds guidance $200 million to $210 million, from $195 million to $205 million (call 2026-06-24) call 2026-09-23; prior guide call 2026-06-24 the company's results call Interest on funds by call Q1 FY26 $48 million; Q2 $54 million incl. realized gains, Q3 $57 million, Q4 $52 million (Q2 to Q4 total $163 million); Q1 FY27 $50 million (call 2026-09-23); year-ago base includes one-time realized gains in Q2 FY26; FY27 guide less Q1 = $150 million to $160 million 5 calls Inve call summaries
Financials
Income statement, last 8 quarters
| Quarter end | Sales | YoY | Operating profit | Op. margin | Other income | PBT | Net profit |
|---|---|---|---|---|---|---|---|
| Aug 2026 | 1,631 | +5.9% | 619 | 38.0% | 10.9 | 565 | 430 |
| May 2026 | 1,606 | +12.5% | 605 | 37.7% | 14.2 | 554 | 421 |
| Feb 2026 | 1,809 | +19.9% | 792 | 43.8% | 15.1 | 739 | 560 |
| Nov 2025 | 1,558 | +18.3% | 572 | 36.7% | 16.8 | 520 | 395 |
| Aug 2025 | 1,540 | – | 542 | 35.2% | 23.8 | 498 | 384 |
| May 2025 | 1,427 | – | 431 | 30.2% | 21.9 | 389 | 297 |
| Feb 2025 | 1,509 | – | 692 | 45.8% | 16.6 | 686 | 519 |
| Nov 2024 | 1,317 | – | 538 | 40.9% | 15.1 | 544 | 413 |
Balance sheet
| As of | Equity | Debt | Cash | Fixed assets | Total assets |
|---|---|---|---|---|---|
| Aug 2026 | 3,706 | 4,558 | 601 | 615 | 15,661 |
| May 2026 | 3,735 | 4,556 | 1,088 | 589 | 16,175 |
| Feb 2026 | 4,014 | 4,954 | 1,743 | 569 | 17,511 |
| Nov 2025 | 3,880 | 4,952 | 1,486 | 551 | 16,519 |
Cash flow
| Year end | Operating | Investing | Financing | Free cash flow |
|---|---|---|---|---|
| May 2026 | 2,557 | −1,152 | −2,654 | 2,322 |
| May 2025 | 1,901 | −3,357 | 2,293 | 1,709 |
| May 2024 | 1,898 | −261 | −1,875 | 1,736 |
| May 2023 | 1,706 | 212 | −711 | 1,563 |
Guidance history
| Metric | Target | Due | Verdict | By quarter |
|---|---|---|---|---|
| Quarterly total revenue growth guide | approximately 12% | Q4 FY26 | Achieved |
|
| Quarterly total revenue growth guide | approximately 18% | Q3 FY26 | Achieved |
|
| Quarterly total revenue growth guide | approximately 18% | Q2 FY26 | Achieved |
|
| Quarterly total revenue growth guide (including pending Paycor acquisition) | 10% to 12% | Q4 FY25 | Pending |
|
| Quarterly total revenue growth guide | 4.5% to 5% | Q3 FY25 | Achieved |
|
| Quarterly total revenue growth guide | 4% to 5% | Q2 FY25 | Achieved |
|
| Quarterly total revenue growth guide | approximately 2% | Q1 FY25 | Achieved |
|
| HR Copilot / generative AI HR guidance tool launch | launch at the start of the next fiscal year | Q1 FY26 | Achieved |
|
| Paycor stand-alone recurring revenue growth (ex-float) | double-digit growth on a full-year basis | FY26 | Diluted |
|
| Paycor acquisition revenue synergies contribution to growth | 30 to 50 basis points of growth in fiscal 2026 | FY26 | Achieved |
|
| Paycor acquisition cost synergies | $80 million | FY26 | Achieved |
|
| Adjusted diluted earnings per share growth | 8.5% to 10.5% | FY26 | Achieved |
|