Lam Research · LRCX
Lam Research says tight supply among its own vendors held down its revenue guide
Revenue rose 22.3% on the quarter before, yet the midpoint of Lam's guide implies 4.6% growth this quarter, and Lam said tight supply at its own component vendors kept the figure lower.
Published · Inve Research Desk
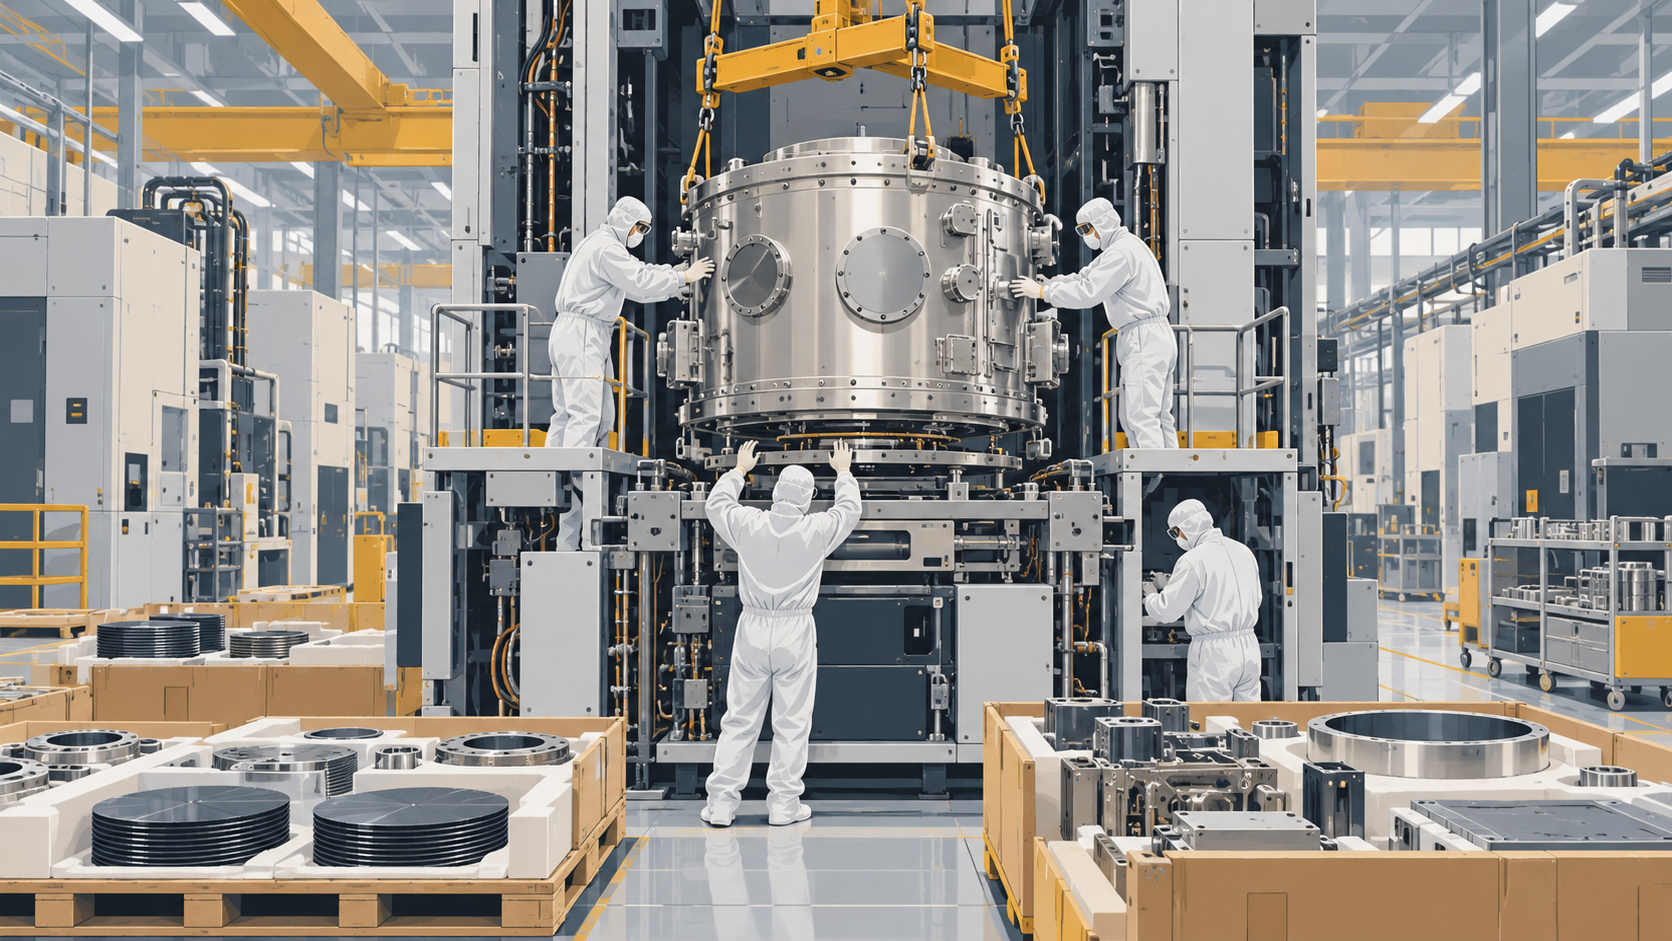
Lam Research makes the machines that lay down and etch away the thin layers of a chip. Through most of this year the brake on its growth was at its customers: in January 2026 the company said a shortage of clean-room space, the sealed factory floor where its tools are installed, was limiting how much chipmakers could spend. On 21 October 2026 it named a limit closer to home. Douglas Bettinger, the chief financial officer, said the revenue guide for the current quarter, $8.6 billion at the midpoint, "would have been a bit higher, if not for some near-term supply chain constraints that we are actively managing". Tim Archer, the chief executive, said some of Lam's own suppliers were seeing its orders to them grow much faster than Lam itself.
The quarter just reported showed no slowdown. Revenue was $8.22 billion in the September 2026 quarter, 22.3% more than in the quarter before. Operating margin on the company's non-GAAP measure, which leaves out items such as amortisation of acquired intangibles, reached 40.2%. The guide's midpoint implies growth of 4.6% on that base, calculated from the reported revenue, a clear step down from the two quarters before it.
Lam's guide implies 4.6% growth this quarter, after revenue rose 15.1% and then 22.3%
%
Revenue growth on the quarter before
- 15.08% Two quarters ago
- 22.27% Last quarter
- 4.63% This quarter, guide
Management would not say how much revenue the supply limit costs. Asked by an analyst, Bettinger declined to put a number on it, and said that whatever slipped out of this quarter for reasons of timing would ship in the following quarter, which ends in March. Archer added that the tightness was nothing like the shortages of the pandemic years. If they are right, the gap is a delay rather than lost business.
Measured against the guide given a quarter earlier, Lam's revenue has come in above the midpoint in each of the last four quarters, by 2.8% four quarters ago and 1.5% last quarter, calculated from the reported revenue. In dollars the beat has stayed between about $119 million and $145 million, so the percentage narrowed mostly because the revenue base grew.
Lam's revenue beat over its guidance midpoint has shrunk from 2.8% to 1.5% over four quarters
%
Revenue above guide midpoint
- 2.78% Four quarters ago
- 2.48% Three quarters ago
- 1.85% Two quarters ago
- 1.47% Last quarter
The same limit runs through Lam's view of the whole industry. In January the company put this year's spending on wafer fabrication equipment, the tools Lam and its rivals sell, in the $135 billion range; it now expects the mid-$150 billion range. Its first figure for next year is more than $200 billion, and Archer said clean-room space and the supply of certain components would keep chipmakers and toolmakers from meeting all of the demand in 2027. Bettinger said an unconstrained figure would be higher but would not give one. That figure is therefore a view of what the industry can build and install; demand beyond that is left unsized.
Two other explanations deserve weight. China accounted for 35% of revenue last quarter, up from 26% the quarter before, and Bettinger said its share would be significantly lower this quarter; management did not separate that drop from the supply effect. And a company whose revenue has topped the midpoint of its guide in the last four quarters may simply be guiding with room to spare, inside a band of $400 million either way.
What has changed is where the bottleneck sits. Earlier in the year it was the customers' buildings; now it is also Lam's own supply chain, which the company can press but does not run. Archer said the company would have a clearer view of clean-room schedules and component supply by its January call, the usual time for that level of detail on next year's spending.
The record: notes, full financial tables
Notes
Impact 4/5 Guidance Positive
Lam now expects services revenue to grow more than 30% in 2026
Lam said its customer support business, which sells spares, upgrades and services for installed tools, is on course for revenue growth of more than 30% in calendar 2026 and over 15% in 2027. The related revenue line was $2,486.5 million in the September 2026 quarter, 0.6% above the quarter before and 40.0% above a year earlier, calculated from the release. On 28 January 2026 the company had guided this business to "high single digit, maybe low double digit" growth.
Impact 2/5 Balance sheet Mixed
Lam returned 59% of free cash flow this year against an 85% plan
Lam said it returned about 41% of free cash flow to shareholders in the September 2026 quarter and 59% so far in calendar 2026, against a long-term plan to return 85%. Free cash flow was $3,240.0 million in the quarter, calculated as operating cash flow of $3,497.7 million less $257.7 million of capital spending in the release.
Financials
Income statement, last 8 quarters
| Quarter end | Sales | YoY | Operating profit | Op. margin | PBT | Net profit |
|---|---|---|---|---|---|---|
| Sep 2026 | 8,219 | +54.4% | 3,284 | 40.0% | 3,312 | 2,753 |
| Jun 2026 | 6,722 | +30.0% | 2,514 | 37.4% | 2,555 | 2,277 |
| Mar 2026 | 5,842 | +23.8% | 2,047 | 35.0% | 2,012 | 1,826 |
| Dec 2025 | 5,345 | +22.1% | 1,810 | 33.9% | 1,837 | 1,594 |
| Sep 2025 | 5,324 | +27.7% | 1,829 | 34.4% | 1,859 | 1,569 |
| Jun 2025 | 5,171 | +33.6% | 1,741 | 33.7% | 1,779 | 1,720 |
| Mar 2025 | 4,720 | +24.4% | 1,562 | 33.1% | 1,537 | 1,331 |
| Dec 2024 | 4,376 | +16.4% | 1,334 | 30.5% | 1,348 | 1,191 |
Balance sheet
| As of | Equity | Debt | Cash | Fixed assets | Total assets |
|---|---|---|---|---|---|
| Sep 2026 | 13,909 | – | 7,437 | 3,126 | 26,353 |
| Jun 2026 | 12,471 | 3,722 | 5,579 | 2,936 | 23,530 |
| Mar 2026 | 10,585 | 3,730 | 4,751 | 2,833 | 20,792 |
| Dec 2025 | 10,145 | 3,730 | 6,180 | 2,689 | 21,391 |
| Sep 2025 | 10,193 | 3,730 | 6,693 | 2,511 | 21,900 |
Cash flow
| Year end | Operating | Investing | Financing | Free cash flow |
|---|---|---|---|---|
| Jun 2026 | 5,858 | −922 | −5,718 | 4,891 |
| Jun 2025 | 6,173 | −708 | −4,937 | 5,414 |
| Jun 2024 | 4,652 | −371 | −3,996 | 4,256 |
| Jun 2023 | 5,179 | −535 | −2,831 | 4,677 |