
Jabil · JBL
Jabil's $17.55 core EPS guide is about 4x last quarter's; adjusted free cash flow guided to $1.6B, 4% up
Jabil guided FY27 core earnings per share to about four times its latest quarter, from a first quarter guided below that quarter, with one customer's growth and a second-quarter dip still to prove out.
Published · Updated · Inve Research Desk
$17.55
FY27 core EPS guide, five cents under 4 x last quarter
Four times last quarter's $4.40 is $17.60, by our arithmetic: the company guides a full year at its best quarter's pace, from a first quarter guided below it.
How they did last quarter
Better than the company said on earnings and revenue, and closer to the target on inventory, though still above it.
- Revenue$10,616 million, +28.6% on a year agovs June guidance: "in the range of $9.2 billion to $10 billion" (17 June 2026)About $1.0 billion over the midpoint, so the quarter beat on volume, not margin.
- Core earnings per share$4.40, against $3.29 a year ago (+34%)vs June guidance: "core diluted earnings per share to be in the range of $3.80 to $4.20" (17 June 2026)$0.20 above the top of the range, above the guide midpoint in all four FY26 quarters, and above the top of the range in two.
- Net inventory days64 days, down about 4 from the quarter beforevs June guidance: "we expect this to normalize back toward our targeted range in Q4" (17 June 2026); target 55 to 60 daysProgress toward the range, as guided: still 4 days above the top of the target.
A full year guided at the pace of one quarter
Jabil's guide for its next fiscal year comes down to one number: core earnings of $17.55 a share. Core is the company's own measure, which leaves out amortization, stock-based pay and restructuring costs. In the latest quarter it earned $4.40 a share on that basis. Four times that is $17.60, by our arithmetic. The guide is five cents under it.
So the company is asking its holders to accept that the best of this year's four quarters is now the ordinary one. Yet its own guide for the first quarter of the new year starts lower, below that latest quarter. To make up the difference, the other three quarters then have to average above the latest quarter's pace.
Results cleared the guide midpoint in each quarter of fiscal 2026
There is a reason for the company's confidence. In September 2025 it guided core earnings for this year at $11 a share. It raised that in December, again in March, and again in June, then finished at $13.09, well above where it began. The raises came with a pattern: against the range it had given a quarter earlier, core earnings landed above the midpoint in all four quarters, and above the top of the range in two.
The latest beat came from volume, not margin. Revenue ran well over the midpoint of the June guide, while the core margin was what had been guided. Asked whether the new guide is conservative, the chief executive said the company is "always appropriately conservative" and that flawless execution could bring some upside. A guide that keeps being cleared says something about how it is written. It does not settle whether this one will be.
Two tests of the guide: one customer, one quarter
The second hyperscale customer, the head of Intelligent Infrastructure said, began with a single capability and is now a storage program above $1 billion in annual revenue. Last December management had put it at about that size. The chief executive now expects it to be a "10% plus customer" in fiscal 2027, which we take to mean a tenth or more of revenue. On that reading the customer goes from that size to at least about $4.45 billion in a year, by our arithmetic. The company did not name it on the call.
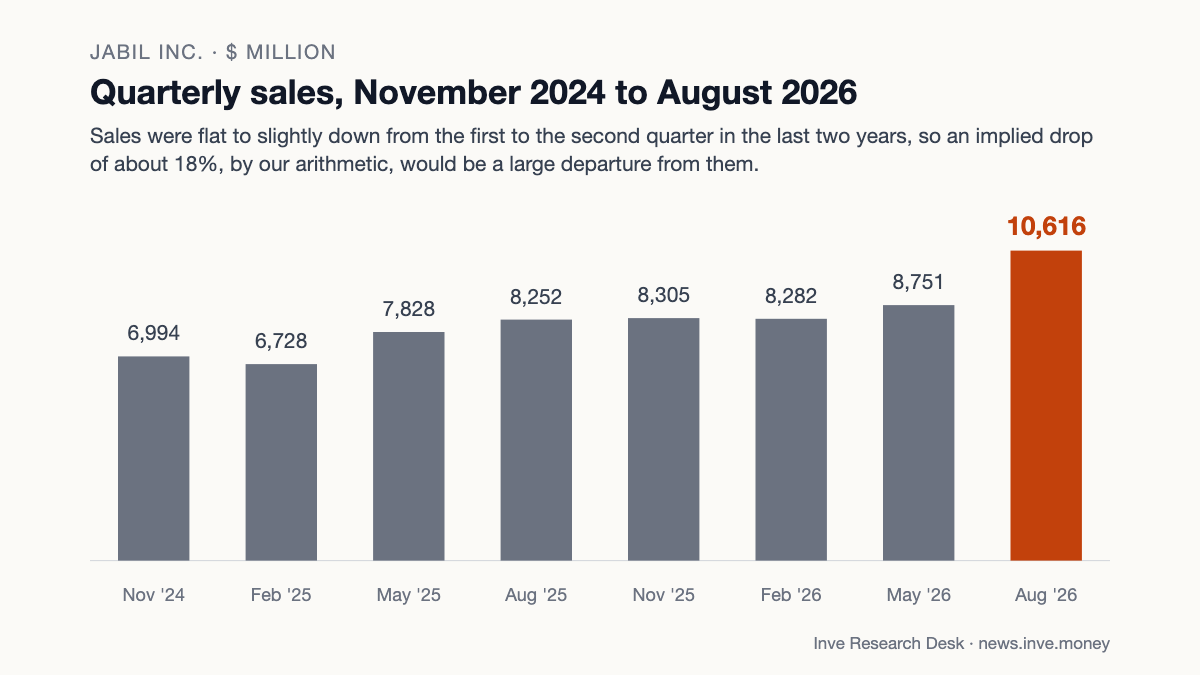
The shape of the year is the second test. The chief executive said revenue splits about 45% to 55% between the first and second halves, with a dip in the second quarter on seasonality. By our arithmetic that puts the second quarter near $9.0 billion, far below where the first quarter is guided. The split is rounded; at last year's split, the second quarter would still be about 14% below the first-quarter midpoint. In each of the last two years the second quarter was flat to slightly down on the first. Either the seasonal dip is about to be much larger than in the last two years, or the split, or the first-quarter guide, has some conservatism in it.
Adjusted free cash flow guided up 4%, core EPS up 34%
The company guided adjusted free cash flow of about $1.6 billion for next year, a little above this year's, by our arithmetic. Adjusted means operating cash flow less capital spending net of asset-sale proceeds. Against core earnings, and holding last quarter's share count, that is about 86% by our arithmetic of core earnings turning into free cash flow. The chief executive says free cash flow conversion should be above 100% "over time". He gave no date on the call. The same remarks put last year's conversion at about 110% of core net earnings, so we take the base as core earnings. The guide sits below that, and the chief financial officer said working capital will absorb more cash as revenue grows.
The growth is being carried on the balance sheet. Total assets rose by nearly half in a year while equity barely moved. Accounts payable, what Jabil owes its suppliers, rose 82%. This year's operating cash flow held up because supplier credit and other liabilities grew about as much as receivables, inventory, prepaid and contract assets absorbed.
Total assets and equity, five quarter-ends
Assets grew by nearly half in a year while equity barely moved, so the growth rests mostly on money owed to suppliers rather than on the owners' capital.
$ million
| Total assets | Equity | |
|---|---|---|
| Aug 2025 | 18,543 | 1,513 |
| Nov 2025 | 19,276 | 1,344 |
| Feb 2026 | 20,628 | 1,344 |
| May 2026 | 23,819 | 1,323 |
| Aug 2026 | 27,435 | 1,613 |
Operating cash flow and operating cash flow less gross capital spending
Operating cash flow rose 22% in FY26 to $2,002 million after falling in FY24 and FY25; less gross capital spending it was $1,374 million, not the company's adjusted free cash flow of $1,532 million.
$ million
| Operating cash flow | Free cash flow | |
|---|---|---|
| Aug 2023 | 1,734 | 704 |
| Aug 2024 | 1,716 | 932 |
| Aug 2025 | 1,640 | 1,172 |
| Aug 2026 | 2,002 | 1,374 |
What we do not know yet
Inventory is a small test of the company's word. In June the chief financial officer said net inventory days should normalize back toward the target range in the fourth quarter. They fell, but are still above the range, and the company now puts the return to it somewhere in the next fiscal year. That is progress toward the range, as guided.
A second line went unmentioned on the call: prepaid expenses and other current assets more than doubled in the year. The company's 10-Q for the quarter to May 2026 put $2.8B of it, against $1.1B at August 2025, in components bought for customers on a net-revenue basis, and attributed the rise mainly to the timing of shipments of customer-controlled consignment components in its Intelligent Infrastructure segment.
This year's free cash flow guide began as a floor, and the year landed at $1,532 million, 18% above that first floor by our arithmetic, a beat about the size of the earnings guide's. The new guide is not a floor. A company that has cleared its guide midpoint for ten straight quarters, since a miss in the February 2024 quarter, has had ten chances to learn where to set it, and it has set the first quarter of the new year below the one just reported.
The record: notes, full financial tables
Notes
Impact 4/5 Demand Mixed
Jabil's second hyperscaler tops $1B a year, expected to be 10%-plus in FY27
Jabil said its second hyperscale customer, a storage program, now brings in more than $1 billion a year, and the chief executive expects it to be a customer of 10% or more in fiscal 2027. Taking that as 10% of revenue, which the call did not specify, on a $44.5 billion guide that means going from above $1 billion to at least about $4.45 billion, by our arithmetic. In December 2025 management put its revenue at roughly $1 billion, up from an earlier $750 million.
“Our second hyperscale customer started with a single capability and has grown into a storage program above $1 billion in annual revenue.”— Matt Crowley, head of Intelligent Infrastructure
Impact 4/5 Guidance Positive
Jabil guides FY27 core EPS to $17.55; Q1 midpoint $4.00 sits under Q4's $4.40
Jabil guided FY27 core earnings per share to $17.55, up 34%, on revenue of about $44.5 billion. The August 2026 quarter's core earnings per share were $4.40, so four times it is $17.60, by our arithmetic, while the first-quarter guide midpoint is $4.00. In FY26 core earnings per share landed above the guide midpoint in each of four quarters, and the FY26 core EPS guide of $11 in September 2025 ended at $13.09. Asked whether the new guide is conservative, the chief executive said it is always so, and that there might be upside.
“we're always appropriately conservative”— Mike Dastoor, chief executive
Impact 3/5 Guidance Mixed
Jabil's 45/55 half split puts second-quarter FY27 revenue near $9.0B, by our arithmetic
The chief executive said FY27 revenue splits about 45% to 55% between the first and second halves, with a dip in the second quarter. By our arithmetic, on the $44.5 billion guide and a first-quarter midpoint of $11.0 billion, that leaves about $9.0 billion for the second quarter, 18% below the first. The split is rounded; at last year's 46% the quarter would be near $9.5 billion, 14% below the first. Sales fell 3.8% from the first to the second quarter of FY25 and 0.3% from the first to the second quarter of FY26.
“I think you'll see a little bit of a drop in Q2 just from a seasonality.”— Mike Dastoor, chief executive
Impact 4/5 Balance sheet Mixed
Jabil guides FY27 free cash flow to about $1.6B, 4% above this year's
Jabil guided FY27 adjusted free cash flow to about $1.6 billion, 4.4% above the $1,532 million of FY26, by our arithmetic; accounts payable rose 82% to $14.4 billion. Against core earnings that is about 86% conversion by our arithmetic, against the roughly 110% the chief executive cited for FY26 (our release-based figure is 109.5%). He aims for conversion above 100% over time, gave no date on the call, and in the same remarks put last year's at about 110% of core net earnings, so we take it as over core earnings. The chief financial officer said working capital will take more cash, but he feels good about $1.6 billion.
“We continue to expect free cash flow conversion above 100% over time.”— Mike Dastoor, chief executive
Impact 3/5 Balance sheet Mixed
Jabil's net inventory days fall to 64 from about 68, still above the 55-60 target
Net inventory days (net of customer deposits) fell about 4 to 64 in the August 2026 quarter, while the target range is 55 to 60 days. In June the chief financial officer said he expected days to move back toward that range in the fourth quarter. The company now says the return comes during fiscal 2027, with gross days at about 82. That is progress toward the range, as guided.
“we expect continued improvement and a return to that range as we move through fiscal 2027”— Gregory Hebard, chief financial officer
Financials
Income statement, last 8 quarters
| Quarter end | Sales | YoY | Operating profit | Op. margin | PBT | Net profit |
|---|---|---|---|---|---|---|
| Aug 2026 | 10,616 | +28.6% | 602 | 5.7% | 522 | 398 |
| May 2026 | 8,751 | +11.8% | 445 | 5.1% | 366 | 275 |
| Feb 2026 | 8,282 | +23.1% | 374 | 4.5% | 300 | 223 |
| Nov 2025 | 8,305 | +18.7% | 283 | 3.4% | 220 | 146 |
| Aug 2025 | 8,252 | +18.5% | 337 | 4.1% | 279 | 218 |
| May 2025 | 7,828 | +15.7% | 403 | 5.1% | 290 | 222 |
| Feb 2025 | 6,728 | −0.6% | 245 | 3.6% | 184 | 117 |
| Nov 2024 | 6,994 | −16.6% | 197 | 2.8% | 139 | 100 |
Balance sheet
| As of | Equity | Debt | Cash | Fixed assets | Total assets |
|---|---|---|---|---|---|
| Aug 2026 | 1,613 | 3,379 | 1,739 | 3,005 | 27,435 |
| May 2026 | 1,323 | 3,378 | 1,360 | 2,899 | 23,819 |
| Feb 2026 | 1,344 | 3,876 | 1,830 | 2,840 | 20,628 |
| Nov 2025 | 1,344 | 2,887 | 1,572 | 2,831 | 19,276 |
| Aug 2025 | 1,513 | 2,885 | 1,933 | 2,847 | 18,543 |
Cash flow
| Year end | Operating | Investing | Financing | Free cash flow |
|---|---|---|---|---|
| Aug 2026 | 2,002 | −1,335 | −866 | 1,374 |
| Aug 2025 | 1,640 | −714 | −1,204 | 1,172 |
| Aug 2024 | 1,716 | 1,351 | −2,668 | 932 |
| Aug 2023 | 1,734 | −723 | −680 | 704 |
| Aug 2022 | 1,651 | −858 | −888 | 266 |