J.B. Hunt Transport Services · JBHT
J.B. Hunt added $624 million of revenue and just $4 million of operating income
Driver, fuel and medical costs landed before the price increases J.B. Hunt is counting on, and most of the repricing in its biggest segment falls in 2027 contracts.
Published · Inve Research Desk
J.B. Hunt Transport Services stock page → More news from Oct 17, 2026

0.7%
of each extra revenue dollar reached operating income
Against a year earlier, revenue rose $623.9 million and operating income $4.4 million: cost arrived faster than price. Of the added revenue, $285.2 million was fuel surcharge; excluding it, revenue rose $338.7 million (calculated from the release).
How they did last quarter
Delco put operating income last quarter at the better end of the guidance given at the September investor conference, though it fell from the quarter before and margin slipped below last year's.
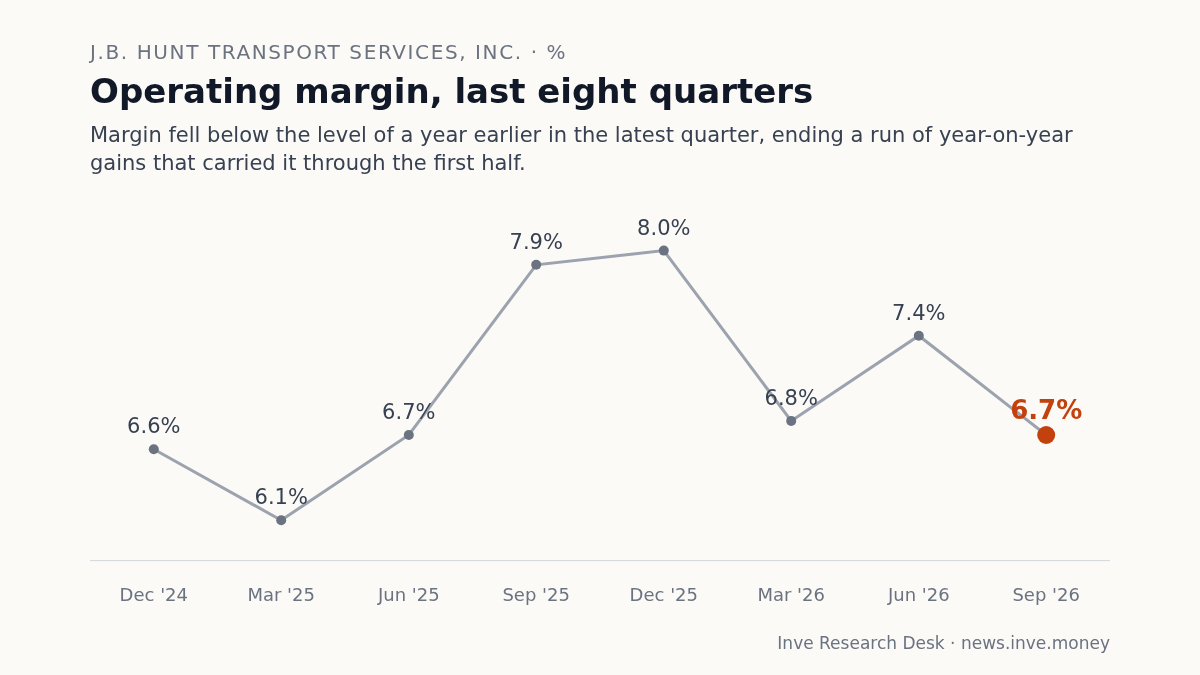
- Operating margin6.7%, operating income $247.1 millionvs 7.9% a year earlier and 7.4% the quarter beforeMargin is lower on both comparisons even though revenue rose 20.4%.
- Dedicated operating income$81.7 million, down 22%vs $104.3 million a year earlierThe segment earned less while adding trucks, as start-up and driver costs came first.
- Intermodal revenue per load, ex-fuelUp 2% on 8% more loadsvs Up 1% in the quarter to June 2026Volume grew far faster than price, and the gap to highway pricing is described as more than double its norm of around 15%, so the repricing is still ahead.
Revenue grew 20% and operating income barely moved
J.B. Hunt's revenue last quarter was 20% higher than a year earlier, yet operating income rose by only $4.4 million. Put another way, less than one cent of each additional revenue dollar reached operating profit, and operating income was lower than in the quarter before.
Part of the margin drop is arithmetic. Fuel surcharges, which pass diesel costs on to customers, swelled revenue, so the reported margin overstates the squeeze. Leaving them out, on our calculation from the release, operating margin was 8.2% against 9.1% a year earlier: a smaller decline, but a decline.
Sales and operating profit, last eight quarters
Sales have climbed for two quarters while operating profit peaked in the quarter to June 2026 and fell in the latest quarter: extra revenue is not turning into extra profit.
$ million
| Sales | Operating profit | |
|---|---|---|
| Dec 2024 | 3,146 | 207 |
| Mar 2025 | 2,921 | 179 |
| Jun 2025 | 2,928 | 197 |
| Sep 2025 | 3,053 | 243 |
| Dec 2025 | 3,097 | 247 |
| Mar 2026 | 3,057 | 207 |
| Jun 2026 | 3,495 | 260 |
| Sep 2026 | 3,677 | 247 |
Driver, medical and fuel costs arrived before price
Chief financial officer Brad Delco put the hit from driver-related investment, fuel volatility and claims at more than $50 million of operating income compared with the quarter before. Slightly more than half was onboarding, training, sign-on bonuses and driver wages, costs he said must be recovered through pricing. Fuel eased late in the quarter and medical costs are hard to predict, so part of the hit could reverse. Delco was still direct that "some of these costs will be with us in Q4 as well as into next year."
The other lever has less left in it. Darren Field, who runs Intermodal, said further large cost-cutting initiatives will be very difficult in this environment and that the focus is now price.
Dedicated earned less while its fleet grew
Dedicated Contract Services shows the timing problem most clearly. Its operating income was $81.7 million, down 22% from a year earlier, as growth-related costs and inflation outweighed solid demand, Hicks said. About 425 trucks were sold in the quarter, but the number of revenue-producing trucks rose by only 120 from the quarter before. A truck sold is not yet a truck earning, and the segment's president, Bradley Hicks, said new accounts take months to reach targeted profitability.
At the April and July calls, management described only modest operating income growth for Dedicated in 2026. That sentence was not on this call or in the release. Hicks said instead that "we will likely see some modest margin pressure associated with starting up these accounts."
Intermodal repricing falls mostly in 2027
Intermodal is the company's largest segment by operating income. Loads grew 8%, but revenue per load excluding fuel rose just 2%. Management says the price gap between intermodal and highway trucking is more than double its historical norm, which it sees as an opening. In July, Field said the company expected that gap to close over the rest of the year. In October he said the gap had widened for now, and that nobody will know whether the coming cycle closes it until the company has gone through it.
The schedule explains the wait: only a small slice of the intermodal book reprices in the fourth quarter, and about 30% in each of the three after it. In Field's words, "it does take some time into next year before the prices really begin to show up inside the results." Volume growth was itself held back at moments by the company's own drayage capacity, Field said in a separate answer.
Capital spending steps up in the fourth quarter
Management still targets about $700 million of net capital spending for the year. With $291.1 million spent in the first nine months, that implies about $409 million in the fourth quarter, calculated from the target and the reported figures; the third quarter was far lighter. The company attributes the step-up to its Dedicated pipeline.
J.B. Hunt Transport Services stock page →
The record: notes, full financial tables
Notes
Impact 4/5 Guidance Negative
J.B. Hunt Dedicated profit falls 22% to $81.7M; the call did not repeat its growth outlook
Dedicated Contract Services said its results were below expectations, with growth-related costs and inflation outweighing solid demand. Operating income was $81.7 million in the September 2026 quarter, down from $104.3 million a year earlier, and margin was 8.5% against 12.1% on our calculation. Nine-month Dedicated operating income is $271.6 million against $278.2 million a year earlier, down 2.4%, and the call did not repeat the April and July outlook of only modest operating income growth for 2026.
“we will likely see some modest margin pressure associated with starting up these accounts.”— Bradley Hicks, President of Dedicated Contract Services
Impact 4/5 Margin Negative
J.B. Hunt puts a quarter's cost hit above $50M and says some of it lasts into 2027
Chief financial officer Brad Delco said driver-related investment, fuel volatility and claims and medical costs cut operating income by more than $50 million against the quarter before, with group medical alone above $16 million. Operating income was $247.1 million, down 4.8% from $259.5 million in the June 2026 quarter, and up only 1.8% on a year earlier against 20.4% revenue growth. In July the company described a tight driver market, with sign-on bonuses in select markets.
“some of these costs will be with us in Q4 as well as into next year.”— Brad Delco, Chief Financial Officer
Impact 4/5 Guidance Mixed
J.B. Hunt intermodal loads rose 8% but revenue per load excluding fuel rose 2%
Intermodal, the segment with the largest share of operating income, carried 585,582 loads against 539,907 a year earlier, while revenue per load excluding fuel rose 2% and operating margin edged down to 8.1% from 8.2% on our calculation. Management said the price gap to highway trucking is more than double its historical norm of around 15%. In July, Darren Field said the company expected that gap to close over the rest of 2026; in October he said the gap had widened for now, and whether the coming bid cycle fully closes it nobody will know until the company has gone through it.
“it does take some time into next year before the prices really begin to show up inside the results.”— Darren Field, President of Intermodal
Impact 3/5 Capex Mixed
J.B. Hunt keeps a roughly $700M capex target, which would imply about $409M in Q4
Net capital spending was $146 million in the third quarter, and management expects it to rise in the fourth on its Dedicated pipeline while still targeting about $700 million for the year. Nine-month net capex was $291.1 million against $490.9 million a year earlier, so an exact $700 million would imply about $409 million in the fourth quarter, calculated from those figures. In April the company had reiterated a range of $600 million to $800 million, and $700 million is the midpoint of that range.
“we expect CapEx to trend higher in Q4, but still targeting approximately $700 million for the year.”— Brad Delco, Chief Financial Officer
Impact 3/5 Balance sheet Mixed
J.B. Hunt nine-month operating cash flow fell 14% while operating income rose 15%
Net cash from operating activities was $1,108.4 million in the first nine months of 2026, against $1,292.7 million a year earlier, while operating income rose 15.4% to $713.6 million. Net capital spending fell to $291.1 million from $490.9 million, so operating cash flow less net capex was about $817.3 million against $801.8 million, on our calculation from the release.
Financials
Income statement, last 8 quarters
| Quarter end | Sales | YoY | Operating profit | Op. margin | PBT | Net profit |
|---|---|---|---|---|---|---|
| Sep 2026 | 3,677 | +20.4% | 247 | 6.7% | 231 | 172 |
| Jun 2026 | 3,495 | +19.4% | 260 | 7.4% | 243 | 181 |
| Mar 2026 | 3,057 | +4.6% | 207 | 6.8% | 189 | 142 |
| Dec 2025 | 3,097 | −1.6% | 247 | 8.0% | 233 | 181 |
| Sep 2025 | 3,053 | −0.5% | 243 | 7.9% | 225 | 171 |
| Jun 2025 | 2,928 | 0.0% | 197 | 6.7% | 176 | 129 |
| Mar 2025 | 2,921 | −0.8% | 179 | 6.1% | 160 | 118 |
| Dec 2024 | 3,146 | −4.8% | 207 | 6.6% | 192 | 156 |
Balance sheet
| As of | Equity | Debt | Cash | Fixed assets | Total assets |
|---|---|---|---|---|---|
| Sep 2026 | 3,634 | 1,124 | 3.8 | 5,364 | 8,087 |
| Jun 2026 | 3,657 | 1,145 | 4.2 | 5,371 | 7,945 |
| Mar 2026 | 3,594 | 1,303 | 4.6 | 5,435 | 7,931 |
| Dec 2025 | 3,565 | 1,467 | 17.3 | 5,538 | 7,927 |
| Sep 2025 | 3,572 | 1,602 | 52.3 | 5,641 | 8,108 |
Cash flow
| Year end | Operating | Investing | Financing | Free cash flow |
|---|---|---|---|---|
| Dec 2025 | 1,678 | −575 | −1,133 | 948 |
| Dec 2024 | 1,483 | −664 | −826 | 618 |
| Dec 2023 | 1,745 | −1,685 | −58 | −118 |
| Dec 2022 | 1,777 | −1,550 | −530 | 236 |