Persistent Systems · PERSISTENT
Persistent's 20% growth owes about six points to one software contract that also cut its margin
Dollar revenue grew 20% last quarter, but the large contract behind it took 90 basis points off the EBIT margin from the quarter before, and bookings and the Nagarro financing moved less favourably.
Published · Inve Research Desk

15.0%
EBIT margin last quarter
100 basis points below the quarter before, 130 below a year ago. The wage increase cost a net 140 and amortising the contract's third-party tools and licences 90, expected for two to three quarters; lower G&A and currency added 150.
How they did last quarter
Growth beat the 17.6%, 17.3% and 16.2% of the September 2025, December 2025 and March 2026 quarters, but margin fell below both the quarter before and a year ago, and bookings rose only 4%.
- Dollar revenue$487.6 million, up 20% on a year agovs 17.6%, 17.3% and 16.2% in Q2, Q3 and Q4 FY26Faster than each of the three FY26 quarters shown, helped by the large software contract.
- EBIT margin15.0%, down 130 basis points on a year agovs 16.0% in the quarter before and 16.3% a year agoLower than both; amortising the large contract's third-party tools and licences cost 90 basis points.
- Total contract value$633.5 million, about 4% above a year ago (calculated from the reported figures)vs $609.2 million a year agoBookings grew far more slowly than revenue, though the quarter before held the large contract.
- Reported profit after tax₹351.5 crore, down 25.4% on a year agovs Operating profit after tax of ₹495.2 crore, up 5%The ₹143.6 crore gap, calculated from the two figures, is the ₹185.3 crore of Nagarro cost booked, after tax; the company says about 3.1 points of margin.
Growth of 20% arrived with a thinner margin
In the September 2026 quarter Persistent Systems reported dollar revenue of $487.6 million, up 20% on a year ago and faster than in each of the earlier quarters shown. Its EBIT margin, which is profit before interest and tax as a share of revenue, fell to 15.0%, 130 basis points below a year ago (a basis point is one-hundredth of a percentage point).
The large contract runs through both results. Management said the quarter's growth rested on two large developments: a multi-year software contract with one of its biggest customers, and a vendor consolidation at a large financial-services client. The chief executive said most of the contract would already have ramped up.
The contract that lifted revenue also cost margin
The chief financial officer's walk from the quarter before shows the link. The contract came with third-party software licences and cloud spend; amortising the third-party tools and licences cost 90 basis points of margin. The largest hit was the yearly wage increase, and lower utilisation also took a share; lower general and administrative costs and a favourable currency added back more than the contract cost. The net result was a fall on the quarter before.
Asked whether the licence cost would stay in the base for the next few quarters, the CFO said yes, easing as spend is optimised and revenue grows.
Without the contract, growth looks nearer 14%
Calculated from the company's figures, the underlying pace is lower. The June call put the contract at $125 million-plus a year; if most of that run-rate sits in the quarter's revenue, growth without it comes to about 14% against the reported rate.
Treat that as a rough illustration, not a restated growth rate. The annual figure is a floor, part of the contract had already reached revenue the quarter before, and the vendor consolidation, which management did not size, sits on top.
Bookings grew far more slowly than revenue
Bookings give a read on revenue to come, and they were softer. Total contract value, the full value of contracts signed in the quarter, was $633.5 million, about 4% above a year ago. The chief executive said a few deals had slipped and that decision-making had slowed in recent weeks, adding: "No excuses, we could have done better."
The comparison is demanding, because the quarter before held the large contract. Without the contract's value, that quarter's total would have been at most $496.2 million, below this quarter's.
The Nagarro financing now includes equity
In June the Nagarro purchase was described as funded by a committed bridge loan. On the latest call the company said it will replace that loan with longer-term capital, raising $1.25 billion through both debt and equity, including a share placement or equity-linked instruments such as convertible bonds, and that shareholders approved the funding mix. For holders, that adds a possible share issue to a deal first presented as debt-funded.
The CFO said the debt had yet to be raised and, asked about its cost, said "it is pretty much in the range of between 5% to 6%". Persistent's own borrowings, which do not include Nagarro, have also risen since the previous half-year balance sheet.
Persistent's own borrowings, last four balance-sheet dates
Borrowings rose in the latest six months before any Nagarro debt arrives; the table excludes Nagarro, so the acquisition financing is additional.
₹ crore
| Debt | |
|---|---|
| Mar 2025 | 232 |
| Sept 2025 | 404 |
| Mar 2026 | 394 |
| Sept 2026 | 499 |
The margin trajectory has become an aspiration
A year ago the margin outlook had numbers attached. On the then-current trajectory, the chief financial officer said the company was looking at about 100 basis points of improvement in the then-current year and probably the same again the year after. That year closed 90 basis points higher. By April the wording was an aspiration for 16% to 17%, with growth the first priority. The chief executive, Sandeep Kalra, kept that range on the latest call and said: "We don't give forward-looking guidance. Please take this as an aspirational goal. We want to be in that bracket."
The latest call did not repeat the 100 basis point figure for FY27 (we searched the transcript).
Persistent Systems stock page →
The record: notes, full financial tables
Notes
Impact 4/5 Balance sheet Mixed
Persistent's Nagarro funding adds equity to a plan first described as all debt
Persistent said it will replace the EUR 1.4 billion bridge loan with longer-term capital, raising $1.25 billion in total through both debt and equity, and shareholders approved the mix on 5 October 2026. On the 28 June 2026 call the purchase was described as completely funded by a committed bridge loan, with the bridge priced at Euribor plus 175 to 250 basis points, 4.1% to 4.8% in our summary of that call. The CFO said debt was yet to be raised, with a working assumption of 5% to 6% on a net basis. The two may not be on the same basis.
“it is pretty much in the range of between 5% to 6%”— Vinit Teredesai, chief financial officer
Impact 4/5 Margin Negative
Persistent's EBIT margin falls to 15.0%; October's 100 bps FY27 trajectory is not repeated
EBIT margin was 15.0% in the September 2026 quarter, 130 basis points below a year ago and 100 below the quarter before, with amortisation of the large contract's third-party tools and licences costing 90 basis points. In October 2025 the CFO said the company was looking at about 100 basis points in FY26 and probably another 100 in FY27, on the then-current trajectory; FY26 closed at 15.6%, 90 basis points higher, per the April 2026 call. The latest call described 16% to 17% as an aspiration, and did not repeat the 100 basis point figure for FY27 (we searched the transcript).
“We don't give forward-looking guidance. Please take this as an aspirational goal. We want to be in that bracket.”— Sandeep Kalra, chief executive and executive director
Impact 4/5 Demand Mixed
Persistent's 20% dollar growth owes about six points to one contract
Dollar revenue was $487.6 million in the September 2026 quarter, up 20% on a year ago against 17.6%, 17.3% and 16.2% in the September 2025, December 2025 and March 2026 quarters, and management tied it to a $650 million-plus software contract and a vendor consolidation. Calculated from the company's figures, if the contract is running at three-quarters to four-fifths or more of the $125 million-plus a year the June call gave, about $23 million to $25 million in the quarter, growth without it is about 14%. That is a rough illustration, so the 14% is nearer a ceiling than a midpoint, as the vendor consolidation was not sized.
“it was underpinned by 2 large things that happened”— Sandeep Kalra, chief executive and executive director
Impact 3/5 Order book Mixed
Persistent's contract bookings rose about 4% against 20% revenue growth
Total contract value was $633.5 million last quarter against $609.2 million a year earlier, and new-business value was $367.1 million against $350.8 million. The CEO said a few deals had slipped and decision-making had slowed in recent weeks. The quarter before held the $650 million contract and a total of $1,146.2 million; without that contract it would have been at most $496.2 million, below the latest total.
“No excuses, we could have done better.”— Sandeep Kalra, chief executive and executive director
Impact 3/5 One-off Negative
Persistent's reported profit falls 25.4% on Nagarro costs; ESOP test may exclude them
Reported profit after tax was ₹351.5 crore in the September 2026 quarter, down 25.4% on a year ago, against operating profit after tax of ₹495.2 crore, up 5%; the gap of ₹143.6 crore, calculated from the two figures, is the ₹185.3 crore of Nagarro transaction cost the company booked, after tax. The company expects about $50 million of one-time cost, $19 million to $20 million already incurred. Employee share vesting needs 12% revenue and 12% EPS growth; operating EPS rose 4.2% in the quarter. On the call, management did not say over what period the test is measured, so one quarter's 4.2% is not itself the test.
“the Board may seek shareholders' approval to treat these onetime transaction-related expenses as an exception when assessing the ESOP vesting conditions”— Sandeep Kalra, chief executive and executive director
Financials
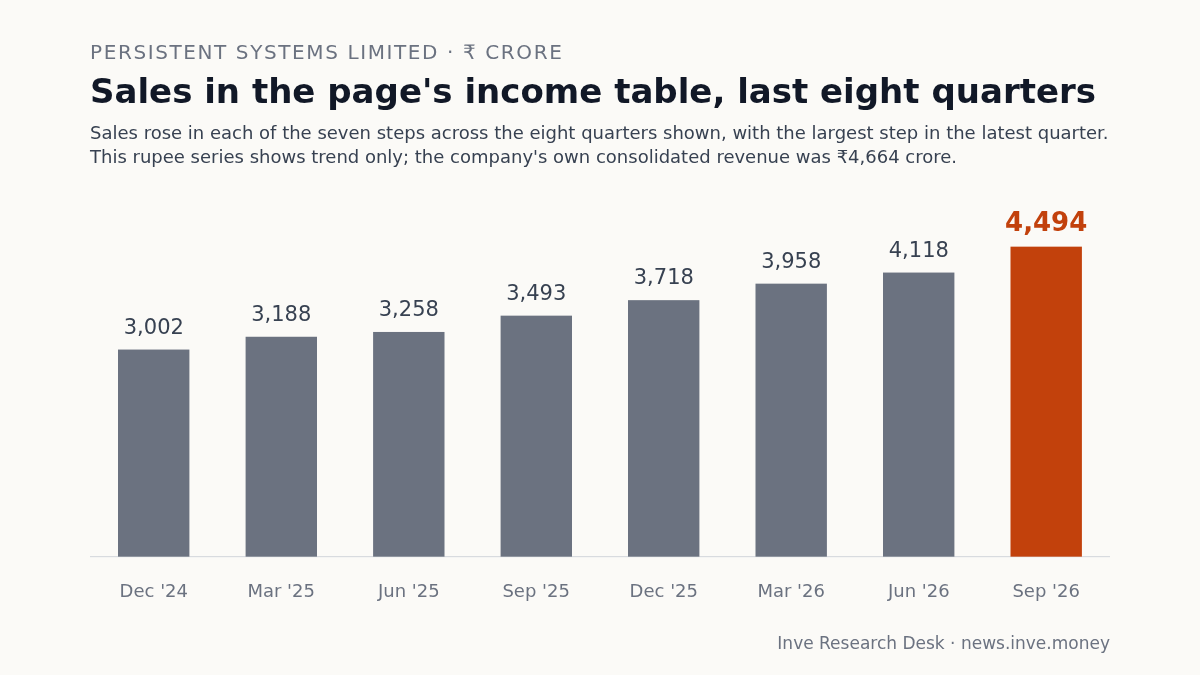
Income statement, last 8 quarters
| Quarter end | Sales | YoY | Operating profit | Op. margin | Other income | PBT | Net profit |
|---|---|---|---|---|---|---|---|
| Sept 2026 | 4,494 | +28.7% | 745 | 16.6% | 19.0 | 656 | 483 |
| Jun 2026 | 4,118 | +26.4% | 599 | 14.5% | 50.0 | 546 | 402 |
| Mar 2026 | 3,958 | +24.2% | 598 | 15.1% | 62.0 | 570 | 420 |
| Dec 2025 | 3,718 | +23.9% | 685 | 18.4% | −69.0 | 532 | 388 |
| Sept 2025 | 3,493 | +22.7% | 661 | 18.9% | 40.0 | 620 | 459 |
| Jun 2025 | 3,258 | +21.1% | 523 | 16.1% | 46.0 | 493 | 367 |
| Mar 2025 | 3,188 | +95.5% | 405 | 12.7% | 10.0 | 354 | 281 |
| Dec 2024 | 3,002 | +79.9% | 476 | 15.9% | 45.0 | 457 | 326 |
Balance sheet
| As of | Equity | Debt | Investments | Fixed assets | CWIP | Total assets |
|---|---|---|---|---|---|---|
| Sept 2026 | 7,471 | 499 | 2,331 | 1,326 | 9.0 | 11,080 |
| Mar 2026 | 6,710 | 394 | 2,604 | 1,145 | 38.0 | 10,680 |
| Sept 2025 | 7,147 | 404 | 1,337 | 2,716 | 17.0 | 9,890 |
| Mar 2025 | 5,603 | 232 | 1,777 | 872 | 77.0 | 7,652 |