
FactSet Research Systems · FDS
FactSet beat its opening growth-guide midpoint in each of the last two years; adjusted margin trailed the year before for seven quarters
Management says faster subscription growth squeezed margin; the new guidance asks for a margin recovery on slower growth while buybacks outrun free cash flow.
Published · Updated · Inve Research Desk
FactSet Research Systems stock page → More news from Sep 30, 2026

7
quarters of adjusted margin below a year ago, our count
By our arithmetic, adjusted margin has trailed the year-before quarter seven times running while reported revenue grew: more sold, a smaller share of each dollar kept.
How they did last quarter
Better than guided on growth and per-share profit; margin inside its guided range but under the midpoint, and the quarter ended below both a year earlier and the quarter before.
- Organic ASV added$86M, the largest of the five quarters checkedvs $81.8M a year earlier [20], and the full-year guide raised to $130M-$160M on 31 March 2026 [19]The year finished at $168.2M, $8.2M above the raised top of the range.
- Adjusted operating margin33.0% in the quartervs 33.8% a year earlier and about 34% the quarter beforeLower than both, and the seventh straight quarter below the year before, by our arithmetic.
- Adjusted EPS, full year$18.01, up 6.1%vs guidance of $17.25-$17.75Above the top of the range, though adjusted net income rose only 1.2%.
The margin has trailed the year before for seven quarters
FactSet's adjusted operating margin, the share of each sales dollar left after running costs and before amortization and one-off charges, was 33.0% in the August 2026 quarter, against 33.8% a year earlier. The gap is small; the run it belongs to is not. By our arithmetic the margin has been below the same quarter a year before for seven straight quarters, while reported revenue grew in each. The company sold more and kept less of each dollar.
We use the year-before yardstick on purpose. Quarter to quarter the margin stepped down three times in a row in each of the last two fiscal years, so that comparison says little.
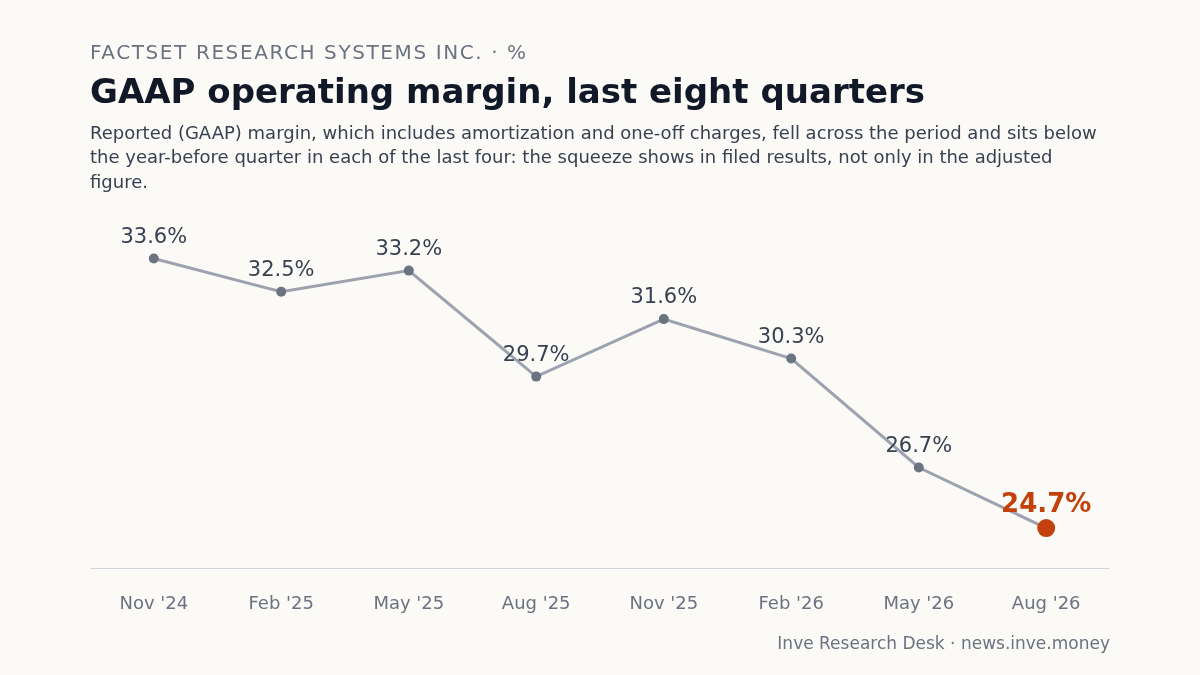
Management says faster subscription growth cost the margin
Management's explanation is that faster subscription growth compresses margin, and the release adds technology spending as a second cause. Annual subscription value, or ASV, is the next twelve months of subscription revenue under contract. Bonuses tied to it are expensed at once, while the revenue comes in over the life of the contract; compensation expense rose faster than revenue last quarter.
The guidance record shows the growth. For fiscal 2025 the company narrowed its organic ASV guide in March 2025, keeping the midpoint, and still added about $127M, above that midpoint. The year after, it opened with a higher midpoint than the year before, raised the range in March, and added $168.2M, above even the raised top. Management called the latest quarter, at $86M, the largest it has booked, and it is the largest of the five most recent quarters we checked; by our arithmetic it was half of the year's total.
The new guidance asks for more margin from slower growth
For fiscal 2027 management guided adjusted margin of 34.75% to 35.25%, above fiscal 2026's result, and said that last year's margins "represented a floor". Organic ASV growth is guided at 5.0% to 6.5%, which by our arithmetic is below the dollar amount just added.
For that to work, ASV adds have to land inside the guided range rather than above it, and the job cuts management described for September have to deliver. By management's own explanation, faster ASV growth compresses margin, so another beat would strain the margin guide. In both fiscal years the margin ended in the lower half of its guided range.
Per-share growth is running ahead of profit growth
The margin slide leaves adjusted net income up only 1.2%, while adjusted EPS rose 6.1%. The difference is a shrinking share count. The company spent more on buybacks and dividends than it generated in free cash flow, and its cash balance fell over the year. Owners are being paid partly from the balance sheet.
That sits beside notes due next March, which the finance chief said it is reasonable to assume will be refinanced at a higher rate, with the $1.5B revolver undrawn.
Cash, debt and equity, last four quarter-ends
Cash and equity fell while debt held steady: buybacks drew down the balance sheet, leaving less cushion for $500M of notes due; the $1.5B revolver was undrawn at 31 August 2026, which management says de-risks that maturity.
$ million
| Cash | Debt | Equity | |
|---|---|---|---|
| Nov 2025 | 275 | 1,369 | 2,168 |
| Feb 2026 | 268 | 1,369 | 2,129 |
| May 2026 | 288 | 1,390 | 2,032 |
| Aug 2026 | 233 | 1,370 | 2,002 |
What we do not know yet
We do not know whether the medium-term margin target, which was not repeated on this call, comes back at the company's Investor Day on 10 November 2026. We do not know the paid share of the MCP clients management counts, or when the incentive design will change. The first read on the new guidance is the next quarterly report.
A company that finishes above the midpoint of its growth guidance and lands in the lower half of its margin guidance two years running has a pattern, not an accident. What the third year shows is whether the explanation was still needed.
FactSet Research Systems stock page →
The record: notes, full financial tables
Notes
Impact 4/5 Margin Mixed
FactSet guides FY27 margin up 25-75 bp after seven quarters below the year before
FactSet guided fiscal 2027 adjusted operating margin of 34.75% to 35.25%, up 25 to 75 basis points, and said fiscal 2026 margins were a floor. Adjusted margin was 33.0% in the August 2026 quarter against 33.8% a year earlier; by our arithmetic it has been below the year-before quarter for seven straight quarters, with reported revenue up 4.5% to 7.1% in each. The fiscal 2026 guide was 34.0% to 35.5%, and the company finished at 34.5%, under its 34.75% midpoint. The 37%-38% medium-term margin figure cited on 18 September 2025 was not repeated; the Investor Day is on 10 November 2026.
“we believe that FY '26 operating margins represented a floor”— Joshua Warren, chief financial officer
Impact 4/5 Guidance Mixed
FactSet guides FY27 organic ASV growth to 5.0-6.5%, about $128-167M, against $168.2M added
FactSet guided fiscal 2027 organic ASV growth of 5.0% to 6.5%, about $128M to $167M by our arithmetic, below the $168.2M added in fiscal 2026; the midpoint, about $148M by our arithmetic, is above both opening midpoints ($115M and $125M), and its range, about $38M wide against $50M for each opening range, is narrower, both by our arithmetic. In fiscal 2025 the guide opened at $90M-$140M, narrowed to $100M-$130M on 20 March 2025 (same $115M midpoint), and the company added about $127M, about 11% above it. Fiscal 2026 opened at $100M-$150M, was raised to $130M-$160M on 31 March 2026, and ended $8.2M above that top.
“this guidance is higher and tighter than what FactSet has provided in the last 2 years”— Joshua Warren, chief financial officer
Impact 3/5 Balance sheet Mixed
FactSet's $808M of FY26 buybacks and dividends topped $707.5M of free cash flow
FactSet returned $808.1M through buybacks and dividends in fiscal 2026 against free cash flow of $707.5M, which is 114% of it by our arithmetic. Cash and equivalents were $233.3M at 31 August 2026 against $337.7M at 31 August 2025. Adjusted EPS rose 6.1% to $18.01 while adjusted net income rose 1.2%. A $500M issue of 2.9% notes falls due in March 2027, against a $1.5B revolver that was undrawn at 31 August 2026.
“I think it's reasonable to assume that we refinance those at higher rates than the 2.9% cost of carry”— Joshua Warren, chief financial officer
Impact 3/5 Demand Mixed
FactSet cites 650+ MCP clients, gives no paid split; July's 20% figure not updated
Over 650 clients were engaged under contracts or trials to take FactSet data through MCP, a standard for connecting AI tools to data, at year-end, up from over 450 on 1 July 2026 (about 44% more by our arithmetic). On 1 July the chief executive said over 20% of the top 100 clients paid for it. Asked on 30 September how many of the 650 paid, the chief executive called the conversion pipeline broadly comparable to the prior quarter and gave no split. The finance chief said over 10% of the quarter's $86M of ASV added came from AI products.
“I'd say it's broadly comparable in terms of the conversion pipeline”— Sanoke Viswanathan, chief executive officer
Impact 3/5 Risk Negative
FactSet's Q4 pay costs rose 9% on revenue up 6.3%; CFO says revenue may diverge from ASV
Compensation expense rose 9% in the August 2026 quarter, driven by performance-based pay, against revenue up 6.3%. The CFO, Joshua Warren, also said such pay is expensed upfront while the matching revenue comes later, and that revenue may diverge from subscription value over time. The chief executive called the incentive design good and said it would keep being refined. On 1 July 2026 the company had reported compensation up 7% and said margin was down about 300 basis points.
“We have a very good design in place. It rewards our teams appropriately.”— Sanoke Viswanathan, chief executive officer
Impact 2/5 One-off Mixed
FactSet folds FY27 amortization and one-offs into one $85-97M line, down from $155.4M
FactSet's fiscal 2027 outlook bridges GAAP operating income of $806M-$840M to adjusted $903M-$925M through one line, amortization of intangible assets and other discrete items, of $85M-$97M, against $155.4M of add-backs in fiscal 2026. By our arithmetic, subtracting about $75.5M of amortization (four times the August 2026 quarter's $18.9M), other items would be about $10M to $22M; the CFO gave no split. Fiscal 2026 included $46.2M of restructuring, a cash cost, and BCC Group, an acquisition announced after year-end, may add amortization we cannot see.
“We've consolidated all of our kind of all of our items purely for simplicity's sake as far as noncash items”— Joshua Warren, chief financial officer
Financials
Income statement, last 8 quarters
| Quarter end | Sales | YoY | Operating profit | Op. margin | Other income | PBT | Net profit |
|---|---|---|---|---|---|---|---|
| Aug 2026 | 635 | +6.3% | 157 | 24.7% | – | 144 | 121 |
| May 2026 | 623 | +6.4% | 166 | 26.7% | −12.2 | 154 | 127 |
| Feb 2026 | 611 | +7.1% | 185 | 30.3% | −23.8 | 161 | 133 |
| Nov 2025 | 608 | +6.8% | 192 | 31.6% | −2.0 | 190 | 153 |
| Aug 2025 | 597 | +6.2% | 177 | 29.7% | 11.6 | 189 | 154 |
| May 2025 | 586 | +5.9% | 194 | 33.2% | −14.2 | 180 | 149 |
| Feb 2025 | 571 | +4.5% | 186 | 32.5% | −13.2 | 172 | 145 |
| Nov 2024 | 569 | +4.9% | 191 | 33.6% | −11.6 | 180 | 150 |
Balance sheet
| As of | Equity | Debt | Cash | Investments | Fixed assets | Total assets |
|---|---|---|---|---|---|---|
| Aug 2026 | 2,002 | 1,370 | 233 | 32.0 | 79.2 | 4,143 |
| May 2026 | 2,032 | 1,390 | 288 | 16.1 | 82.3 | 4,192 |
| Feb 2026 | 2,129 | 1,369 | 268 | 16.9 | 84.4 | 4,220 |
| Nov 2025 | 2,168 | 1,369 | 275 | 17.2 | 85.0 | 4,221 |
| Aug 2025 | 2,186 | 1,368 | 338 | 17.4 | 85.2 | 4,304 |
Cash flow
| Year end | Operating | Investing | Financing | Free cash flow |
|---|---|---|---|---|
| Aug 2026 | 822 | −133 | −799 | 708 |
| Aug 2025 | 726 | −393 | −408 | 618 |
| Aug 2024 | 700 | −144 | −561 | 615 |
| Aug 2023 | 646 | −95 | −632 | 585 |
| Aug 2022 | 538 | −2,034 | 1,339 | 487 |