Domino's Pizza · DPZ
Domino's cuts its US store opening guidance again as franchisee profit slips
Domino's lowered its 2026 US net new store guidance to 125-150 and said franchisee profit is falling in dollars, while a supply-chain margin gain carried a third of its operating income growth.
Published · Inve Research Desk
125-150
net new US stores guided for 2026
Down from 175-plus guided in February, after 71 net openings in the first three quarters.
How they did last quarter
Profit beat management's own expectations, but sales and store growth fell short of what the company guided in February.
- US same-store sales+0.3%, with US pricing of +1.2%vs +5.2% a year earlier; February guidance for the year, "we talked about 3% for the year", and the nine months are +0.4%Close to flat: pricing did the work, so order counts, items per order and mix together were a drag.
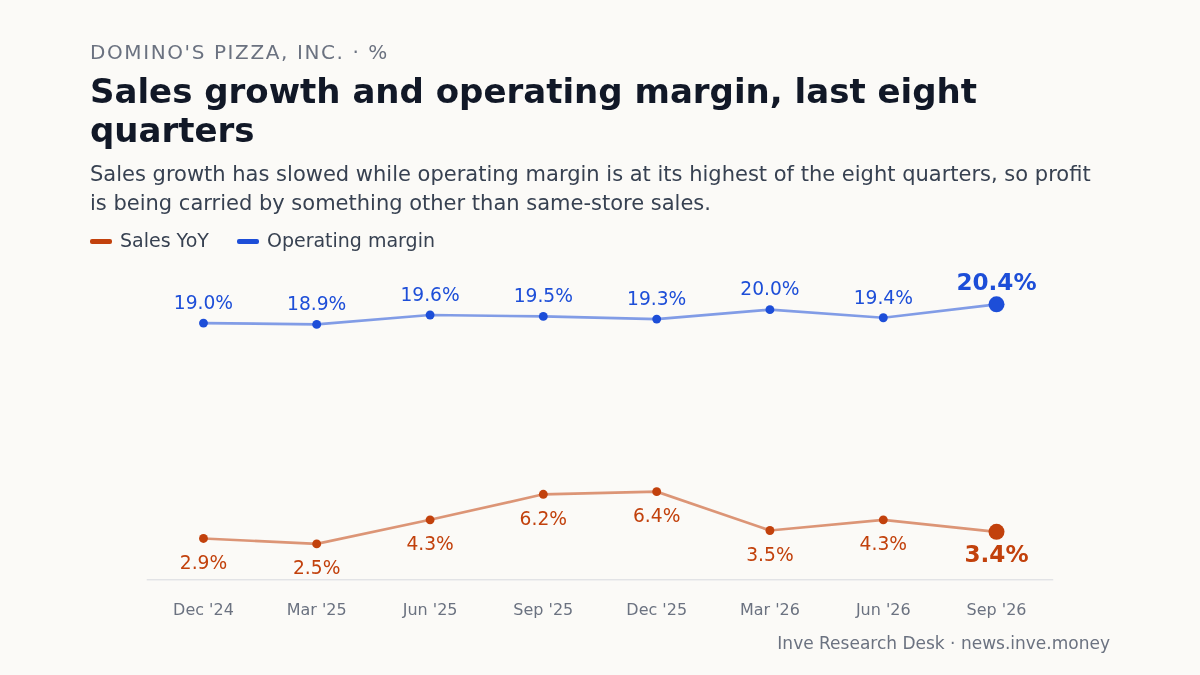
- Operating income$241.8 million, up 8.3%, margin 20.4%vs 19.5% margin a year earlierProfit grew faster than sales, helped by royalties on a larger store base and a higher supply-chain margin, not by same-store sales.
- US net new stores26 in the quarter, 71 so far this yearvs February guidance: "We continue to expect 175-plus net stores in the U.S., and we have a robust pipeline"The year is now guided to 125-150, so the final quarter carries a smaller but still large load.
The US store guide was trimmed in July, cut in October
Domino's said on 13 October that it now expects 125-150 net new US stores this year. In February it expected 175-plus, and in July it trimmed that to approximately 175. The US system grew by 71 stores in the first three quarters, so the final quarter has to add between 54 and 79, calculated from the new range. Management described openings as heavily weighted to the fourth quarter, and it stressed that closures have been few, so the cut is about stores not being opened rather than stores being shut. The company said its long-term potential of 8,500-plus US stores is unchanged, and that closures have been in single digits in each of the last couple of years.
Last October the CFO described the growth plan as resting on a steady pace of net new US stores through 2028. The company did not repeat that on this call, and the new chief executive, Joe Jordan, pointed to guidance for next year in February.
Franchisee profit is behind the slower openings
Domino's earns when its franchisees open and run stores: it collects royalties on their sales and sells them dough, cheese and other ingredients through its supply chain. Franchisees open stores when stores pay. Management attributed the cut to a development pipeline under pressure from the economy and from weaker franchisee profit this year.
The company has not put a figure on that. In February it gave the average US franchise store's profit for the prior year. Asked for this year's number, the CFO declined to quantify it but said "there's year-on-year pressure in terms of absolute dollars on franchisee profitability". Asked whether openings would be lower next year, he said the pressure on openings would last until franchisee profit turns. The full-year profit figure is due with fourth-quarter results.
Flat same-store sales, profit up on the supply chain
Behind the squeeze is a same-store sales line that has almost stopped growing. US same-store sales rose 0.3% last quarter, against 5.2% a year earlier. US pricing added 1.2%, so everything else, meaning order counts, items per order and the mix of what customers bought, netted to about minus 0.9 points, calculated from the two figures. In July the company called the ticket shortfall under its own control; this time it said ticket improved from the second quarter on its own actions, while the consumer environment held down items per order.
Operating income still rose 8.3%. A good part of that came from the supply chain, where gross margin was 12.2% against 11.3%, which the release attributes mainly to procurement productivity. Holding last year's margin on this year's supply-chain revenue, the gain accounts for 34% of the increase in operating income, a calculation from the filed figures. Royalties and fees from franchisees added more in dollars than the margin gain did. In February management expected supply-chain margins to grow this year but with less procurement productivity than in recent years; the CFO said this quarter's gain was expected, and that looking ahead it is focused on gross profit dollars rather than margin expansion.
The profit guide was lowered too
The company's own guidance moved the same way. It now expects operating income growth in the mid-single digits for 2026, excluding currency, refranchising gains and a gain on its aircraft. It is the second cut this year: it guided approximately 8% in February and mid- to high single digits in April, which it kept in July. It also lowered its US same-store sales guide to the low end of low single digits.
Third-quarter operating income came in slightly above management's expectations; the CFO said the same-store sales outlook assumes the difficult economic and competitive environment lasts through the rest of the year.
The record: notes, full financial tables
Notes
Impact 5/5 Guidance Negative
Domino's cuts 2026 US net new stores to 125-150 from 175-plus, citing franchisee profit
Domino's now expects 125-150 net new US stores in 2026, its second reduction: from 175-plus in February to approximately 175 in July, and now 125-150. The US added 71 stores in the first three quarters, so the fourth has to add 54-79, calculated from the guide, against 96 a year earlier. Asked about 2027, the CFO said on the call that pressure on openings continues until franchisee profit turns.
“there's year-on-year pressure in terms of absolute dollars on franchisee profitability”— Sandeep Reddy, CFO
Impact 4/5 Guidance Negative
Domino's trims 2026 operating income guidance to mid-single digits, from mid- to high
The company now guides 2026 operating income growth in the mid-single digits, excluding currency, refranchising gains and an aircraft gain; it guided approximately 8% in February and mid- to high single digits from April. It moved its US same-store sales guide to the low end of low single digits (3% in February, low single digits since April), after +0.3% in the third quarter and +0.4% over nine months. International same-store sales are now guided about flat, from low single digits in April and July (1% to 2% in February).
“we are now expecting operating income growth in the mid-single digits”— Sandeep Reddy, CFO
Impact 3/5 Demand Negative
Domino's US sales rose 0.3% on 1.2% pricing as fewer items went into each order
US same-store sales rose 0.3% in the third quarter with pricing of 1.2%, so everything else netted to about minus 0.9 points, calculated from the two, against minus 0.1 in the second quarter. Management said orders grew, and that items per order fell. In July it called the ticket shortfall under its own control; this time it said ticket improved from the second quarter on its own actions, while the consumer environment held down items per order.
“the environment being what it is, is going to put that offsetting pressure on items per order”— Sandeep Reddy, CFO
Impact 3/5 Margin Mixed
Domino's supply-chain margin rose to 12.2%, supplying about a third of the profit increase
Supply-chain gross margin was 12.2% against 11.3% a year earlier, which the release attributes mainly to procurement productivity. Holding last year's margin, the gain added about $6.4 million, 34% of the $18.6 million rise in operating income, calculated from the filed figures. In February management expected supply-chain margins to grow this year, with less procurement productivity than in recent years; looking ahead, the CFO said it is focused on gross profit dollars, not margin.
“I think margin expansion is not really much of what we're focused on”— Sandeep Reddy, CFO
Impact 3/5 Risk Mixed
Domino's CEO opens the door to moving markets away from Domino's Pizza Enterprises
Asked about renewals with Domino's Pizza Enterprises, CEO Joe Jordan said he was more encouraged than in quite some time, but that if it cannot make a market work he would help move it to another operator. International same-store sales rose 0.2% in the third quarter and fell 0.1% over nine months, and the company still guides about 800 international net new stores.
“if they can get the results, I'm happy for them to keep those markets”— Joe Jordan, CEO
Impact 3/5 Balance sheet Mixed
Domino's would be comfortable running leverage below 4x; $1.3 billion of debt is current
Leverage was 4.2x trailing Consolidated Adjusted EBITDA against 4.5x a year earlier, the fall coming, by our calculation, from higher EBITDA rather than repayment. The current portion of debt rose to $1,326.8 million from $6.1 million at the end of 2025, while fixed-rate notes were unchanged at $4,766.1 million. In the first three quarters buybacks and dividends took $442.6 million, by our calculation 96% of free cash flow.
“we would be comfortable operating below the low end of our leverage target of 4x in this current environment”— Sandeep Reddy, CFO
Financials
Income statement, last 8 quarters
| Quarter end | Sales | YoY | Operating profit | Op. margin | PBT | Net profit |
|---|---|---|---|---|---|---|
| Sep 2026 | 1,186 | +3.4% | 242 | 20.4% | 195 | 152 |
| Jun 2026 | 1,194 | +4.3% | 232 | 19.4% | 175 | 136 |
| Mar 2026 | 1,151 | +3.5% | 230 | 20.0% | 181 | 140 |
| Dec 2025 | 1,536 | +6.4% | 296 | 19.3% | 230 | 182 |
| Sep 2025 | 1,147 | +6.2% | 223 | 19.5% | 179 | 139 |
| Jun 2025 | 1,145 | +4.3% | 225 | 19.6% | 168 | 131 |
| Mar 2025 | 1,112 | +2.5% | 210 | 18.9% | 193 | 150 |
| Dec 2024 | 1,444 | +2.9% | 274 | 19.0% | 221 | 169 |
Balance sheet
| As of | Equity | Debt | Cash | Fixed assets | Total assets |
|---|---|---|---|---|---|
| Sep 2026 | −3,955 | 3,559 | 229 | 375 | 1,766 |
| Jun 2026 | −3,982 | 4,876 | 165 | 374 | 1,763 |
| Mar 2026 | −3,907 | 4,876 | 233 | 387 | 1,845 |
| Dec 2025 | −3,901 | 4,811 | 126 | 324 | 1,717 |
Cash flow
| Year end | Operating | Investing | Financing | Free cash flow |
|---|---|---|---|---|
| Dec 2025 | 792 | −70 | −752 | 672 |
| Dec 2024 | 625 | −31 | −532 | 512 |
| Dec 2023 | 591 | −107 | −476 | 486 |
| Jan 2023 | 475 | −54 | −516 | 388 |