
Delta Air Lines · DAL
Delta's revenue outran its fuel bill by $810 million; its own costs took back $786 million
Delta cut its full-year adjusted earnings guidance to $5.10-$5.60 a share, three months after affirming $6.50-$7.50, after fuel ran $0.46 a gallon above July's assumption and non-fuel unit cost growth rose to 7.3% against a January guide of low single digits.
Published · Inve Research Desk

$5.35
midpoint of new adjusted full-year EPS guide, per share
By our arithmetic that is 23.6% below the $7.00 midpoint set in January and affirmed in July, and 8.1% below 2025's adjusted $5.82: a year guided to grow now shrinks.
How they did last quarter
Revenue arrived as guided, but fuel and non-fuel costs did not, so last quarter fell below the bottom of the profit guidance given in July.
- Adjusted operating margin9.4%, against 11.1% a year agovs July guidance of "11% to 13%"Missed by 1.6 points below the bottom of the range, and lower than a year earlier.
- Adjusted earnings per share$1.72, against $1.70 a year agovs July guidance of "$2 to $2.50"Flat on the year but $0.28 below the bottom of the guide.
- Non-fuel unit costUp 7.3%, against 6.8% in the quarter before, both on the definition Delta adopted in Januaryvs July guidance to "improve modestly" and January's "low single digit"Cost growth got worse, not better, and sits well above a low single-digit framework.
- Adjusted revenue and fuel priceRevenue up 16%; fuel $3.61 a gallonvs July guidance of "mid-teens" revenue growth and fuel of "approximately $3.15 per gallon"Revenue met its guide; fuel ran about $0.46 a gallon above the assumption.
The earnings guide affirmed in July is gone
In July Delta's chief executive affirmed the adjusted (non-GAAP) earnings guidance set in January: $6.50 to $7.50 a share. In October the company cut it to $5.10 to $5.60. The top of the new range is below the bottom of the old one, and the midpoint falls with it, by our arithmetic. A year guided to grow is now a year guided to shrink.
The chief executive framed the year another way: pretax profit of roughly $4.5 billion, which he called fairly close to last year's. Last year's was $5 billion, so it is about 10% lower by our arithmetic.
Revenue paid for the fuel, then costs took the money back
In the September 2026 quarter, revenue growth covered the rise in Delta's fuel bill with $810 million to spare, by our arithmetic. That was price, not volume: passenger miles barely moved. The spare money did not reach profit, because non-fuel costs rose $786 million by our arithmetic. Adjusted operating margin was 9.4%, below the bottom of the range guided in July. Revenue met its guide; fuel ran well above the July assumption, by our arithmetic enough on its own to exceed the profit shortfall, and non-fuel unit cost rose rather than improved.
The July line that second-half operating margin would be double-digit was not repeated on the call or in the release. The new guidance implies something lower, by our arithmetic.
Cost growth is the line Delta set its own target for
In January Delta said it expected another year of low single-digit growth in non-fuel unit cost, its cost per unit of flying capacity excluding fuel. Last quarter the figure was 7.3% on the definition Delta adopted in January. Over the first nine months the figure was 7%. In July management said the September-quarter figure would improve modestly. It got worse.
The CFO named crew and revenue-related costs, on capacity growth several points below the original plan, and nearly 1 point from summer disruption, as the primary drivers. For next year he said "we remain on track for low single-digit unit cost growth as capacity normalizes". The chief executive, asked about capacity, said that if product prices stay high longer than expected, capacity will not be normal by past measures, and will be adapted to the environment.
What would have to be true for 2027
For the repair to work, two things must hold. Fares must hold if fuel falls, and there is no test of that yet. And capacity must recover; the chief executive made that conditional on fuel. Meanwhile the refinery is carrying a large share of the near-term outlook: more than $700 million for the year, the CFO said, and by our arithmetic roughly 38% of the fourth quarter's pretax outlook, on last quarter's gallons. That benefit is a hedge against high fuel cracks, so it shrinks when fuel falls.
Cash agrees with earnings. Free cash flow guidance was cut to about $2.5 billion, and year-end gross leverage lifted to 2.2x. Debt, meanwhile, is coming down.
The cost target now points to 2027
The next full-year report is the next evidence. By our arithmetic the cost improvement the company guided for next quarter would still leave unit-cost growth above low single digits. We do not know yet whether fares hold, or whether the cost target survives without the capacity it depends on.
In January the cost target was this year's. By July the CFO had already moved it to next year: low single digits would come as capacity growth returns to normal, and would depend on next year's setup. In October he repeated it for next year, naming capacity normalizing, operational improvements and lapping higher costs. This year's target is gone in practice: the December-quarter guide implies 5.3% to 6.3% by our arithmetic. What Delta keeps is the long-term framework.
The record: notes, full financial tables
Notes
Impact 5/5 Guidance Negative
Delta cuts 2026 adjusted EPS guidance to $5.10-$5.60 from $6.50-$7.50 after July
Delta now expects full-year 2026 adjusted (non-GAAP) earnings of $5.10 to $5.60 a share, with free cash flow of about $2.5 billion. On 10 July the company affirmed the same-basis $6.50 to $7.50 it set on 13 January, a 20% increase at the midpoint. The new midpoint of $5.35 is 23.6% lower, and 8.1% below 2025's adjusted $5.82, by our arithmetic. The top of the new range sits below the bottom of the old one.
“For the full year, we now expect earnings of $5.10 to $5.60 per share with free cash flow of approximately $2.5 billion.”— Erik Snell, Chief Financial Officer
Impact 4/5 Guidance Negative
Delta's September-quarter margin of 9.4% and EPS of $1.72 miss July's guidance
Delta's adjusted operating margin in the September 2026 quarter was 9.4%, below the 11% to 13% it guided on 10 July and the 11.1% of a year earlier. Adjusted earnings were $1.72 a share against guidance of $2.00 to $2.50. Adjusted fuel cost $3.61 a gallon against about $3.15 all-in assumed in July for that quarter; the CFO's $1.5 billion pretax figure is adjusted, and GAAP pretax was $1,074 million. Neither the call nor the release repeated July's line that second-half operating margin would be double-digit; by our arithmetic the new guidance implies an adjusted 8.2% to 9.2%.
“Pretax profit of $1.5 billion was in line with last year even with a $1.6 billion increase in fuel expense”— Erik Snell, Chief Financial Officer
Impact 4/5 Margin Negative
Delta's non-fuel unit cost rose 7.3% against a January guide of low single digits
Non-fuel unit cost rose 7.3% in the September 2026 quarter on flat capacity, up from 6.8% in the quarter before on the same definition; over the first nine months it rose 7% (14.39 cents against 13.47), the like-for-like comparison with a full-year guide. In January the company guided low single-digit growth for the year; on 10 July it said the September-quarter figure would improve modestly. For the next quarter it guides an improvement of 1 to 2 points, which is 5.3% to 6.3% by our arithmetic. The CFO said the 2027 low single-digit target depends on capacity normalizing, operational improvements and lapping higher costs.
“we remain on track for low single-digit unit cost growth as capacity normalizes”— Erik Snell, Chief Financial Officer
Impact 3/5 Demand Mixed
Delta's revenue growth beat its fuel increase by $810M; non-fuel costs took back $786M
In the September 2026 quarter Delta's adjusted revenue rose $2,388 million and adjusted fuel expense rose $1,578 million, leaving $810 million by our arithmetic. Non-fuel costs rose $786 million, partly revenue-related costs the CFO named as a driver, and MRO expense rose another $55 million, so the $810 million less the $786 million is not the $26 million fall in adjusted operating income, because MRO expense and other lines also moved. Passenger miles rose 1%. The chief executive described this year's fare increases as about 20%, a description rather than a measured figure; the filed measure, passenger yield, rose 14% in the quarter and 11% over nine months.
“even at a 20% price increase, which largely we have taken this year”— Ed Bastian, Chief Executive Officer
Impact 3/5 One-off Mixed
Delta guides a 40-cent-a-gallon refinery benefit for December, up from 13 cents
Delta's fuel guide for the December 2026 quarter includes a refinery benefit of about 40 cents a gallon, against 13 cents last quarter: about $458 million on last quarter's gallons, 38% of the $1.2 billion pretax outlook, by our arithmetic. Adjusted pretax was $1,497 million, $423 million above GAAP's $1,074 million. Under a rule new this year, hedge settlements tied to Monroe refinery inventory still on hand are held out of adjusted results until it is sold; the 10-Qs let you split the $208 million of hedge items: by our arithmetic about $31 million is mark-to-market and about $177 million is settlements on inventory still on hand at 30 September.
“Our outlook includes a refinery benefit of more than $700 million underscoring its unique value.”— Erik Snell, Chief Financial Officer
Impact 3/5 Balance sheet Mixed
Delta cuts 2026 free cash flow guidance to about $2.5 billion and lifts leverage to 2.2x
Delta now guides full-year 2026 free cash flow, a non-GAAP measure the company defines with adjustments, of about $2.5 billion, down from the $3 billion to $4 billion it guided on 13 January and 10 July, a 29% cut at the midpoint by our arithmetic. Year-end gross leverage is guided to about 2.2x, from 2x. Adjusted net debt was $13,350 million at 30 September 2026 against $14,300 million at the end of 2025. September-quarter free cash flow was $463 million against $833 million a year earlier.
“positioning us to end the year with gross leverage of 2.2x”— Erik Snell, Chief Financial Officer
Financials
Income statement, last 8 quarters
| Quarter end | Sales | YoY | Operating profit | Op. margin | Other income | PBT | Net profit |
|---|---|---|---|---|---|---|---|
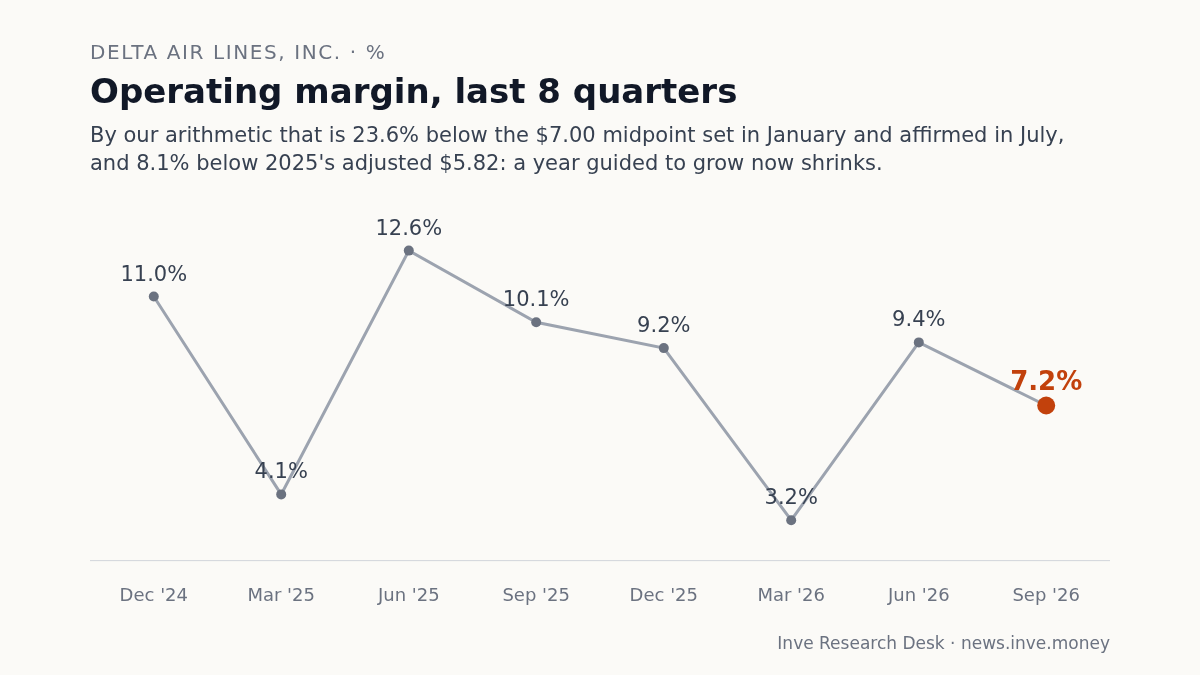
| Sep 2026 | 20,186 | +21.1% | 1,454 | 7.2% | −380 | 1,074 | 756 |
| Jun 2026 | 19,757 | +18.7% | 1,864 | 9.4% | 145 | 2,009 | 1,604 |
| Mar 2026 | 15,854 | +12.9% | 501 | 3.2% | −715 | −214 | −289 |
| Dec 2025 | 16,003 | +2.8% | 1,467 | 9.2% | 47 | 1,514 | 1,218 |
| Sep 2025 | 16,673 | +6.4% | 1,684 | 10.1% | 93 | 1,777 | 1,417 |
| Jun 2025 | 16,648 | −0.1% | 2,102 | 12.6% | 472 | 2,574 | 2,130 |
| Mar 2025 | 14,040 | +2.1% | 569 | 4.1% | −249 | 320 | 240 |
| Dec 2024 | 15,560 | +9.4% | 1,717 | 11.0% | −515 | 1,202 | 843 |
Balance sheet
| As of | Equity | Debt | Cash | Fixed assets | Total assets |
|---|---|---|---|---|---|
| Sep 2026 | 22,513 | 12,105 | 3,787 | 42,206 | 86,048 |
| Jun 2026 | 21,815 | 12,905 | 4,665 | 41,544 | 86,321 |
| Mar 2026 | 20,376 | 13,235 | 5,053 | 40,582 | 84,431 |
| Dec 2025 | 20,853 | 13,308 | 4,310 | 39,743 | 81,317 |
Cash flow
| Year end | Operating | Investing | Financing | Free cash flow |
|---|---|---|---|---|
| Dec 2025 | 8,342 | −4,186 | −3,076 | 3,843 |
| Dec 2024 | 8,025 | −3,739 | −4,260 | 2,885 |
| Dec 2023 | 6,464 | −3,148 | −3,394 | 1,141 |
| Dec 2022 | 6,363 | −6,924 | −4,535 | −3 |