
Costco Wholesale · COST
Costco will spend about 17% more on building again while its member growth keeps slowing
Paid-member growth has slowed to 3.8% while capital spending is guided up about 17% for a third straight year, so the case now leans on each member spending more.
Published · Updated · Inve Research Desk
Costco Wholesale's company page · More news from Sep 29, 2026
3.8%
growth in paid members in the latest quarter
Down from 6.3% a year earlier: the fee-paying base is adding members more slowly, and management gave no outlook for a rebound.7
How they did last quarter
Spending matched guidance; the opening plan was cut twice and still missed, and member growth slowed again.
Paid members 84.1 million, up 3.8% on a year ago
vs 4.1% growth the quarter before and 6.3% a year ago The slowest growth in the series we hold, and management gave no path to a rebound.7Capital spending, full year $6.4 billion
vs guidance of about $6.5 billion, repeated through the spring The dollar guidance was met, a little under.9Net new warehouses, full year 25 opened, net of relocations
vs 30 planned in September 2025, then 28, then 26 The opening plan was cut twice and still was not met.4Earnings per share $6.75, up 15.0%; up 12.4% without the tariff refund effect
vs up 15.2% the quarter before Underlying growth is slower than the headline, and slower than the two quarters before it.11The number to ask for first is falling
Membership fees are a large, steady part of what Costco earns, so the figure to ask for first is how fast that base is growing. In the August 2026 quarter, paid members grew 3.8%1,7. A year earlier growth was 6.3%, and it has slowed at every report since1,12.
Asked what would turn the trend around, the finance chief said the company does not give guidance on it, and that the growth rate "we've seen in recent quarters is probably more typical than what we'd expect to see"7.
The fee increase has stopped doing the lifting
Part of the reason fee income looked healthy was a price rise. Fee income grew 7.3% in the quarter1,8, well below a year ago. The finance chief said this was the last quarter with a year-over-year lift from the higher fee. Excluding the increase and currency effects, fee income grew 6.8%, so the increase now adds under 1 point8.
One thing went better than management had said. In March it expected renewal rates in the US and Canada to slip for a few more quarters13. Instead the rate edged up to the level of a year ago1,8.
Spending guidance is met; opening guidance is not
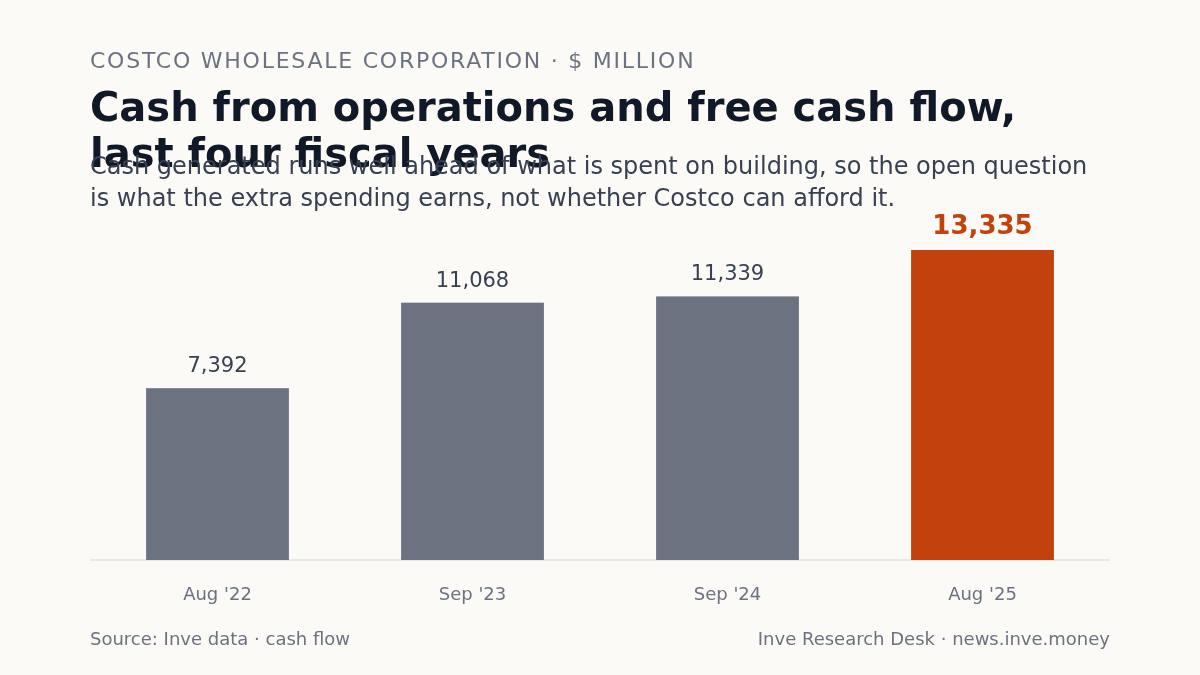
The company now plans about $7.5 billion of capital spending next fiscal year, up roughly 17% and the third year of increases of that size2,9. On dollars it hit the guide this year, after overshooting the year before (about $5 billion guided, $5.5 billion spent)2,9,14. The cash the business throws off covers it, as the exhibit below shows, so the question is the return on the build-out and not whether it can be paid for3.
Buildings are another matter. Last September the plan was 30 net new warehouses for the year. Management cut that twice and still fell short4. The plan for next year is 28 net once relocations are removed, still under the yearly goal it says it is building toward4,10.
Cash from operations and free cash flow, last four fiscal years
Cash generated runs well ahead of what is spent on building, so the open question is what the extra spending earns, not whether Costco can afford it.
$ million
| Operating cash flow | Free cash flow | |
|---|---|---|
| Aug 2022 | 7,392 | 3,501 |
| Sep 2023 | 11,068 | 6,745 |
| Sep 2024 | 11,339 | 6,629 |
| Aug 2025 | 13,335 | 7,837 |
Tariff refunds make profit growth look faster
Reported earnings per share rose 15.0%. Excluding the net effect of $184 million of tariff refunds and the price cuts made with them, the rise was 12.4%5,11. Our rough arithmetic from the 9 basis-point net effect suggests about half went back into prices; management did not confirm the figure, and says it intends to keep reinvesting most of what arrives11. It did not say whether the cuts bring more shoppers.
Operating margin has stayed between 3.7% and 4.0% in the last three quarters we hold, through the quarter reported on 28 May 20266; last quarter's is not in our tables yet. So far the strain is in the growth of members and buildings, not in what each dollar of sales earns.
Operating margin, last eight quarters
Operating margin stayed between 3.7% and 4.0% in the last three quarters reported (to the quarter reported in May 2026); the fourth quarter is not yet in the table.
Operating margin, %
- Feb '24 3.5%
- May '24 3.8%
- Nov '24 3.5%
- Feb '25 3.6%
- May '25 4.0%
- Nov '25 3.7%
- Feb '26 3.7%
- May '26 4.0%
More of the growth now has to come from spend per member
Management describes growth as a balance of more members and more spending by each, and offered spend per member as the reassurance. There is support for that: executive members, who pay a higher fee and spend more, now make up about half of the base and are still growing, and renewal is holding7,8.
What would have to be true is plain enough. Openings must get back to the goal, members in newer markets must mature, and price cuts must bring traffic rather than only thinner margins. Management declined to give a path for member growth, would not confirm the size of its price reinvestment, and offered no view on next year's inflation. We will know more when the company reports again in December, including how large the next tariff benefit is.
Management gave exact figures for what it will spend and none for how many members it expects to add. Companies tend to be exact about what they control.
Sources
- 1. Paid-member growth by call · Paid members +6.8% (Q2 and Q3 FY25), +6.3% (Q4 FY25, 81.0M), +5.2% (Q1 FY26), +4.8% (Q2 FY26, 82.1M), +4.1% (Q3 FY26, 82.9M); US/Canada renewal 92.3% at Q4 FY25; membership fee income +14% (Q4 FY25, $1.72B) · Q2 FY25 to Q3 FY26 · Inve call summaries
- 2. Annual capital spending · FY22 $3.891B; FY23 $4.323B; FY24 $4.710B; FY25 $5.498B (+16.7%) · FY22 to FY25 · Inve data · cash flow
- 3. Nine-month capex and cash flow · 9M FY26 capex $4.228B vs $3.532B; operating cash flow $11.133B vs $9.468B; free cash flow $6.905B vs $5.936B · 9M FY26 vs 9M FY25 · Inve data · cash flow
- 4. Net new warehouse guidance record · FY26 plan 30 net (25 Sep 2025), 28 (11 Dec 2025), 26 (28 May 2026), delivered 25; FY25 plan 26 net, delivered 24 · FY25 and FY26 · Inve Guidance Tracker
- 5. Quarterly EPS growth · Diluted EPS growth Q1 FY26 +11.4% (4.50 vs 4.04), Q2 +13.9% (4.58 vs 4.02), Q3 +15.2% (4.93 vs 4.28) · Q1 to Q3 FY26 · Inve data · income statement
- 6. Operating margin by quarter · Q1 FY26 3.66% vs 3.53%; Q2 3.74% vs 3.63%; Q3 3.99% vs 4.00% · Q1 to Q3 FY26 · Inve data · income statement
- 7. Paid members, latest quarter · Paid members 84.1M (+3.8%); cardholders 150.4M (+3.6%); paid executive members 42.3M (+9.4%) · call 2026-09-24 (16 weeks ended 30 Aug 2026) · the company's results call
- 8. Fee income and renewal · Membership fee income $1.849B, +7.3% (+6.8% excluding fee increase and FX); US/Canada renewal 92.3%; Q4 is the last quarter with a fee-increase benefit; 7.7% excluding FX · call 2026-09-24 · the company's results call
- 9. Capex FY26 and FY27 plan · Capex $6.4B for FY26 ($2.21B in Q4); about $7.5B planned for FY27; growth in spend expected to slow after FY27 · call 2026-09-24 · the company's results call
- 10. Warehouse openings plan · FY26: 28 openings incl. 3 relocations = 25 net; count 939. FY27 plan: 33 openings, 5 relocations, goal of 30 net a year · call 2026-09-24 · the company's results call
- 11. Tariff refunds and EPS · $184M received ($174M refunds + $10M interest); EPS $6.75, +15.0%; ex-item +12.4%; company intends to reinvest the majority of refunds; net gross-margin effect 9 bps on $93.87B net sales, about $84M, vs $174M refunds; management did not confirm the reinvested amount · call 2026-09-24 · the company's results call
- 12. Paid-member growth, Dec 2025 and May 2026 · Q1 FY26 +5.2%; Q3 FY26 +4.1% · Q1 FY26 and Q3 FY26 · Inve call summaries
- 13. Renewal-rate expectation, March 2026 · Q2 FY26 call 2026-03-05: expects a few more quarters of slight US/Canada renewal-rate decline · Q2 FY26 · Inve call summaries
- 14. Capex guidance record · FY26: about $6.5B guided at Q1, Q2, Q3 FY26; FY25: about $5B guided, actual $5.498B, verdict missed · FY25 and FY26 · Inve Guidance Tracker
The record: notes, full financial tables, guidance history
Notes
Impact 4/5 Demand Mixed
Costco paid-member growth slows to 3.8%, with no outlook for a rebound from management
Paid members reached 84.1 million, up 3.8% in the 16 weeks ended 30 August 2026, and the finance chief declined to give a growth outlook when asked what would reverse the slowdown. Growth was 4.1% at the 28 May 2026 report and 6.3% a year earlier. Fee income rose 7.3% to $1.849 billion, and the fee increase stops adding to that growth after this quarter.
“the growth rate that we've seen in recent quarters is probably more typical than what we'd expect to see”— Gary Millerchip, Chief Financial Officer
Sources (3)
Claim Value Period From Paid-member growth by call +6.3% (Q4 FY25), +5.2% (Q1 FY26), +4.8% (Q2), +4.1% (Q3) Q4 FY25 to Q3 FY26 Inve call summaries Paid-member growth, Dec 2025 and May 2026 Q1 FY26 +5.2%; Q3 FY26 +4.1% Q1 FY26 and Q3 FY26 Inve call summaries Paid members and fee income 84.1M paid members, +3.8%; fee income $1.849B, +7.3% call 2026-09-24 the company's results call Impact 4/5 Capex Mixed
Costco guides FY27 capex to about $7.5 billion, up 17%, after $6.4 billion in FY26
Costco plans about $7.5 billion of capital spending in fiscal 2027, roughly 17% above the $6.4 billion spent in fiscal 2026. That year's spending landed just under the guidance of about $6.5 billion; the year before, the guide had been raised to a little over $5 billion by the third quarter and the spend was $5.498 billion. Management said the growth rate of spend should slow after fiscal 2027, a statement the next few years can test.
“Beyond fiscal year 2027, we would expect to see a slowing in the rate of capital expenditure growth”— Gary Millerchip, Chief Financial Officer
Sources (3)
Claim Value Period From Annual capital spending FY24 $4.710B; FY25 $5.498B FY24 to FY25 Inve data · cash flow Capex guidance record FY26: about $6.5B guided at Q1, Q2, Q3 FY26; FY25: about $5B guided, actual $5.498B, verdict missed FY25 and FY26 Inve Guidance Tracker Capex FY26 and FY27 plan $6.4B FY26; about $7.5B planned FY27 call 2026-09-24 the company's results call Impact 3/5 Guidance Negative
Costco plans 28 net new warehouses in FY27, below its 30-a-year goal
Costco plans 33 openings in fiscal 2027, of which 5 are relocations, or 28 net of relocations. It opened 25 net in fiscal 2026, after planning 30 net in September 2025 and trimming the plan to 28 and then 26. The prior year followed the same pattern: 26 net planned, 24 delivered.
“Our current plan is to open another 33 warehouses in fiscal year 2027, of which 5 are relocations”— Ron Vachris, Chief Executive Officer
Sources (2)
Claim Value Period From Net new warehouse guidance record FY26: 30 net planned, 28, 26, delivered 25; FY25: 26 planned, 24 delivered FY25 and FY26 Inve Guidance Tracker FY27 openings plan 33 openings incl. 5 relocations; goal 30 net a year call 2026-09-24 the company's results call Impact 3/5 One-off Mixed
Costco receives $184 million of tariff refunds; underlying EPS growth 12.4% vs 15.0%
Costco received $184 million in tariff refunds and interest in the quarter and said it intends to reinvest the majority of what it receives in lower prices and member values. Reported earnings per share rose 15.0% to $6.75; excluding the net effect, growth was 12.4%, below the 15.2% of the quarter before. In March 2026 the company said it would return this value through prices. Our rough arithmetic from the 9 basis-point net gross-margin effect suggests about half went back into prices; management did not confirm the amount.
“we intend to continue reinvesting the majority of the dollars we receive and increase member values”— Gary Millerchip, Chief Financial Officer
Sources (4)
Claim Value Period From Quarterly EPS growth Q3 FY26 EPS 4.93 vs 4.28, +15.2% Q3 FY26 Inve data · income statement Tariff refunds and EPS $184M received; EPS $6.75, +15.0%; ex-item +12.4% call 2026-09-24 the company's results call Tariff refund commitment, March 2026 Q2 FY26 (2026-03-05): commitment to return the value through lower prices and better values if refunds are received Q2 FY26 Inve Guidance Tracker Reinvestment arithmetic Net gross-margin effect 9 bps on $93.87B net sales, about $84M, vs $174M refunds; management did not confirm the reinvested amount call 2026-09-24 the company's results call
Financials
Income statement, last 8 quarters
| Quarter end | Sales | Operating profit | Op. margin | PBT | Net profit |
|---|---|---|---|---|---|
| May 2026 | 70,527 | 2,815 | 4.0% | – | 2,192 |
| Feb 2026 | 69,597 | 2,606 | 3.7% | – | 2,035 |
| Nov 2025 | 67,307 | 2,463 | 3.7% | – | 2,001 |
| May 2025 | 63,205 | 2,530 | 4.0% | – | 1,903 |
| Feb 2025 | 63,723 | 2,316 | 3.6% | – | 1,788 |
| Nov 2024 | 62,151 | 2,196 | 3.5% | – | 1,798 |
| May 2024 | 58,515 | 2,197 | 3.8% | 2,284 | 1,681 |
| Feb 2024 | 58,442 | 2,062 | 3.5% | 2,237 | 1,743 |
Balance sheet
| As of | Equity | Debt | Cash | Fixed assets | Total assets |
|---|---|---|---|---|---|
| May 2026 | 33,509 | 5,670 | 18,946 | 34,293 | 86,430 |
| Feb 2026 | 32,087 | 5,760 | 17,383 | 33,645 | 83,639 |
| Nov 2025 | 30,303 | 5,736 | 16,217 | 32,616 | 82,790 |
| Aug 2025 | 29,164 | 5,788 | 14,161 | 31,909 | 77,099 |
Cash flow
| Year end | Operating | Investing | Financing | Free cash flow |
|---|---|---|---|---|
| Aug 2025 | 13,335 | −5,311 | −3,775 | 7,837 |
| Sep 2024 | 11,339 | −4,409 | −10,764 | 6,629 |
| Sep 2023 | 11,068 | −4,972 | −2,614 | 6,745 |
| Aug 2022 | 7,392 | −3,915 | −4,283 | 3,501 |
Guidance history
| Metric | Target | Due | Verdict | By quarter |
|---|---|---|---|---|
| Warehouse relocations completed | 5 relocations | FY26 | Revised Down |
|
| Warehouse openings outside the United States | 12 of the 29 planned openings outside the U.S. | FY25 | Pending |
|
| Warehouse openings in the quarter | 10 warehouses | Q4 FY25 | Achieved |
|
| U.S. and Canada membership renewal rate - continued mix-driven decline | continued slight decline for the remainder of the fiscal year | FY25 | Achieved |
|
| Top-of-scale hourly wage increase of $1 under the employee agreement | additional $1 per hour top-of-scale increase in March 2027 | Q3 FY27 | New |
|
| Top-of-scale hourly wage increase of $1 under the employee agreement | additional $1 per hour top-of-scale increase in March 2026 | Q3 FY26 | Ghosted |
|
| Return of the turkey provolone sandwich to the food court | returns in Q3 | Q3 FY25 | Pending |
|
| Return of IEEPA tariff refunds to members | return the portion of tariffs passed on to members, through lower prices and better values | On Track |
| |
| Reporting change to digitally enabled comparable sales | switch the e-commerce comp metric to digitally enabled comps starting with the September sales release | Q1 FY26 | Achieved |
|
| Pharmacy pay-ahead in the Costco app | launch pay-ahead for the pharmacy | FY26 | Achieved |
|
| Opening of the Baldwin Hills, Los Angeles mixed-use warehouse | open in 2027 | CY2027 | New |
|
| Net year-over-year SG&A headwind from the March 2025 employee agreement | mid-single-digit basis points | Q3 FY25 | Achieved |
|