Constellation Energy · CEG
Constellation lifts its earnings guidance again on the strength of one summer quarter
Constellation's latest raise rests mostly on a strong summer quarter, part of which, its finance chief says, will not recur every year, while the long nuclear contracts meant to steady earnings start in 2028 and buybacks run ahead of free cash flow.
4 min read Published on

Published by
Inve Content team
Constellation Energy stock page → More news from Nov 9, 2026
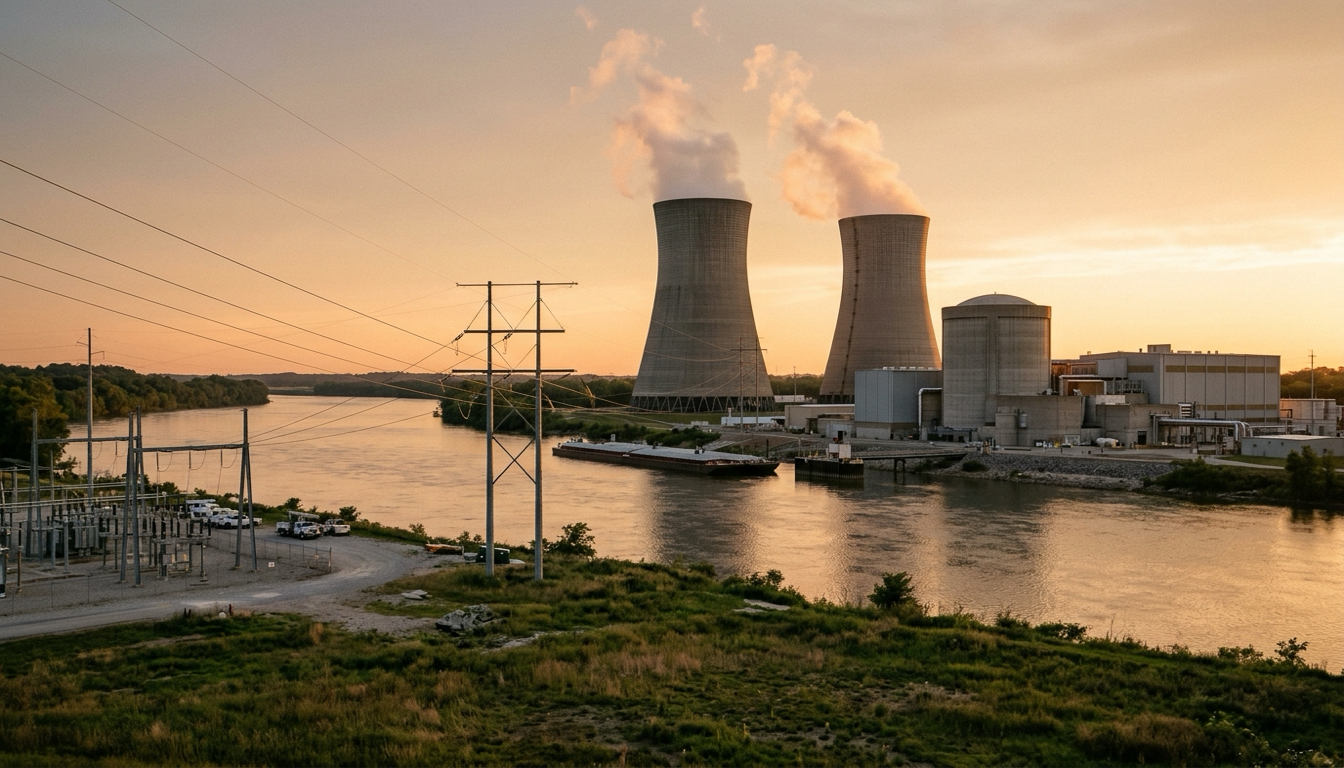
Constellation Energy sells electricity from its nuclear plants and, since it bought Calpine in January, from a large fleet of gas plants as well. It has raised its full-year guidance for adjusted operating earnings, the non-GAAP measure it steers by, to $12.50-$12.80 a share. The bottom of the new range is the top of the range it set in August, when it lifted the guidance once already.
Most of the lift came from a single quarter. In the September 2026 quarter adjusted operating earnings were $5.06 a share, against $3.04 a year earlier. The two quarters before had grown far more modestly over the year before. Calculated from the reported quarters, last quarter alone supplied 62% of the year-on-year gain in the first nine months.
Last quarter supplied most of this year's rise in adjusted earnings per share
$ per share
- Q1 2026 vs a year earlier $0.60
- Q2 2026 vs a year earlier $0.64
- Q3 2026 vs a year earlier $2.02
The finance chief, Shane Smith, named Calpine as the main reason, adding that the summer months are some of the strongest for the Calpine fleet; the release likewise credits market conditions and the addition of Calpine. He also gave credit to the commercial team and to strong plant output, and when asked whether that would carry on he said: "I wouldn't say that is transferable to all years." The new range points the same way. Taking the first nine months away from it leaves $2.15 to $2.45 a share for the fourth quarter, less than any of the three quarters reported so far this year.
What is meant to make the earnings steadier sits further out. At its August results the company said it had signed about 920 megawatts of long-term nuclear contracts in the quarter. Since then it has signed a supply deal with Amazon, two agreements with Google, one of them paying for new capacity at existing reactors, and its first Peak+ contract, which pairs nuclear output with new capacity for a large customer. Management put the total signed this year at more than 8,500 megawatts, more than half of it since August. On price the company spoke of a range rather than individual deals: management said its contracts sit within a premium of $20 to $50 a megawatt-hour over the nuclear tax-credit floor.
Google's load-following deal alone is nearly three times what the company signed the quarter before
MW
- Signed the quarter before 920 MW
- Google load-following deal 2,700 MW
- Amazon supply deal 690 MW
- First Peak+ contract 270 MW
Little of this reaches the income statement soon. The Peak+ supply and the first Google uprate are both due to start in 2028. Mr Smith told analysts that the outlook for next year published in March was "still a good starting point", with this year's deals contributing only later. Guidance for the next two years comes with the year-end results.
In the meantime the company is paying out more than the business throws off. Over the first nine months cash from operations less capital spending came to $1,518 million, while buybacks alone took $3,001 million. With dividends added, shareholders received about 2.3 times that free cash flow, calculated from the release. The difference was covered by short-term borrowing, up a net $2,342 million over the nine months, and by drawing down cash since December, partly to pay $2,537 million for Calpine. Long-term debt more than doubled with the Calpine purchase, even though the company repaid more long-term debt than it issued.
Since December, cash has shrunk while long-term debt and short-term borrowing have both grown
$m
Cash
- $3,641m Dec 2025
- $603m Sep 2026
Short-term borrowings
- $1,650m Dec 2025
- $3,989m Sep 2026
Long-term debt
- $7,250m Dec 2025
- $19,039m Sep 2026
More spending is coming. Mr Smith said the reactor uprate programme includes $3 billion of new growth capital from 2028 onward. Cheaper money may help: the Department of Energy has offered, subject to a signed loan agreement, to guarantee borrowing for the uprates. Chief executive Joe Dominguez said a new buyback plan would come on or before the fourth-quarter results.
None of this undoes a good year. The guidance is higher than in August and the company has signed several times as many megawatts of long-term contracts since August as in the quarter before. But the year's extra earnings and the contracts meant to replace them arrive at different times, and the company is funding buybacks in the gap with cash and short-term borrowing. At the year-end results it will have to set guidance for the next two years, say what the contracts add, and decide how much stock it can keep buying beside the new nuclear spending.
Constellation Energy stock page →
The record: full financial tables
Financials
Income statement, last 8 quarters
| Quarter end | Sales | YoY | Operating profit | Op. margin | Other income | PBT | Net profit |
|---|---|---|---|---|---|---|---|
| Sep 2026 | 9,550 | +45.4% | 2,492 | 26.1% | – | 2,231 | 1,835 |
| Jun 2026 | 7,504 | +23.0% | 580 | 7.7% | 320 | 900 | 513 |
| Mar 2026 | 11,122 | +63.8% | 2,332 | 21.0% | −207 | 2,125 | 1,590 |
| Dec 2025 | 6,074 | +12.9% | 598 | 9.8% | 94 | 692 | 432 |
| Sep 2025 | 6,570 | +0.3% | 1,086 | 16.5% | 309 | 1,395 | 930 |
| Jun 2025 | 6,101 | +11.4% | 951 | 15.6% | 322 | 1,273 | 839 |
| Mar 2025 | 6,788 | +10.2% | 451 | 6.6% | −300 | 151 | 118 |
| Dec 2024 | 5,382 | −7.1% | 972 | 18.1% | −113 | 859 | 852 |
Balance sheet
| As of | Equity | Debt | Cash | Fixed assets | Total assets |
|---|---|---|---|---|---|
| Sep 2026 | 32,712 | – | 603 | 41,738 | 99,185 |
| Jun 2026 | 31,977 | 19,474 | 697 | 41,228 | 98,253 |
| Mar 2026 | 33,483 | 17,364 | 800 | 40,769 | 96,911 |
| Dec 2025 | 14,517 | 7,342 | 3,641 | 22,474 | 57,249 |
| Sep 2025 | 14,350 | 8,919 | 3,959 | 21,990 | 56,161 |
Cash flow
| Year end | Operating | Investing | Financing | Free cash flow |
|---|---|---|---|---|
| Dec 2025 | 4,237 | −3,198 | −420 | 1,288 |
| Dec 2024 | −2,464 | 7,428 | −2,289 | −5,029 |
| Dec 2023 | −5,301 | 3,031 | 2,196 | −7,723 |
| Dec 2022 | −2,353 | 3,104 | −799 | −4,042 |