
Conagra Brands · CAG
Conagra beat its margin guide, held the year, and left the hard tests to the next three quarters
Conagra beat its own 'high single digits' margin guide with 11.5%, but part of the profit beat was overhead timing, and earnings per share leaned on a flour joint venture, so the unchanged full-year guide now asks for a step down.
Published · Updated · Inve Research Desk
11.5%
adjusted operating margin last quarter
By our arithmetic, at least 1.5 points above the guide (we read 'high single digits' as up to 9%; it can run to about 9.9%), though part of the beat was timing and not repeatable.
How they did last quarter
Better than the guide it set in July on margin, but the full-year guide stayed put, partly because some of the beat was timing, and cash went the wrong way.
- Adjusted operating margin11.5%, against 11.8% a year agovs Q1 guide of "we expect Q1 adjusted operating margin in the high single digits" (15 July 2026)Cleared by at least 1.5 points (more than two if 'high single digits' means up to 9%)
- Adjusted earnings per share$0.41, +5.1% on the $0.39 of a year agovs The quarter a year beforeBy our arithmetic the whole rise in adjusted pre-tax income came from Ardent Mills equity earnings; adjusted operating profit fell.
- Free cash flow-$127.9Mvs -$26.2M a year agoA larger cash burn than a year earlier, which leaves more to be made up in the next three quarters.
- Net leverage3.99x net debt to adjusted EBITDAvs 3.83x at the end of FY26; year-end guide of "approximately 4.0x" (15 July 2026 release)Already at the year-end level, so the guide needs cash to arrive in the second half to hold it there.
A low bar, cleared, and a year left as it was
In July, under a new chief executive, Conagra halved its dividend, set a profit guide for the year below the $1.72 it had just earned and said the first quarter's adjusted operating margin would land in the high single digits. It then reported 11.5% for the quarter to 30 August 2026. That is what is left of each sales dollar after running costs.
By our arithmetic that clears the guide by at least 1.5 points. Management then left the full-year guide exactly where it was. Part of the answer is in how the margin was made.
Part of the beat will not repeat
Adjusted pre-tax income rose from a year earlier. By our arithmetic, adjusted operating profit fell, and a rise in equity earnings from Ardent Mills, a flour-milling joint venture, covered the gap. The core business earned less; the joint venture earned more.
The chief financial officer put part of the per-share beat down to administrative costs, half of it one-time and half of it timing, and separately credited Ardent with about the same amount above plan. Subtracting the first quarter from the full-year guide, by our arithmetic (on full-year sales we assume at $10.7-11.0bn), leaves about 9.5% to 10.2% for the next three quarters. The guide already assumes a step down.
Volume and costs are the next tests
The plan rests on how many units shoppers keep buying as prices rise. In Grocery & Snacks, where price and mix are already positive, organic volume fell 5.4% while price and mix added 3.4%. By our arithmetic that is a ratio of 1.6 to 1, already past what management models for the segment. Price and mix includes mix, so it is not a pure price effect, and it is one quarter.
Frozen, where the plan assumes shoppers cut volume faster, has barely started: the Refrigerated & Frozen segment's volume was down only 0.1% last quarter and its new pricing reaches shelves this quarter. Transport inflation, which the finance chief said is running at double the planned rate, add to the squeeze.
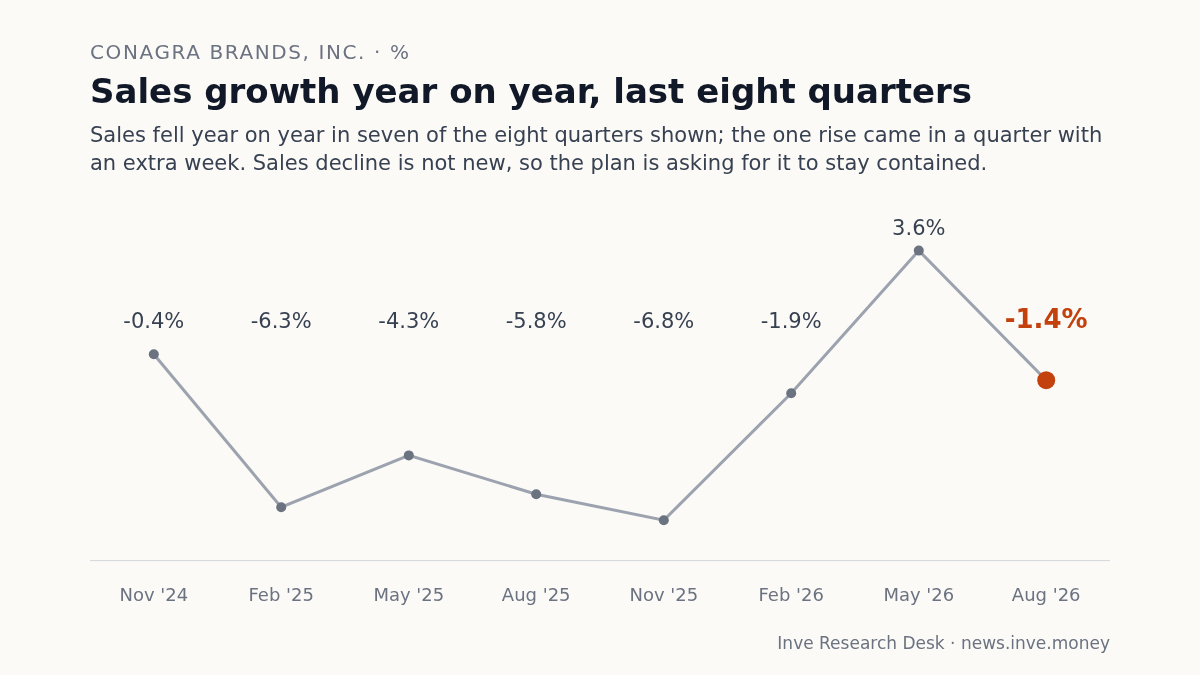
Cash and leverage have to do the work
The quarter used cash: free cash flow was negative, a bigger burn than a year earlier. Net debt to adjusted EBITDA, the leverage ratio, was up from the end of the last fiscal year and already at the year-end guide.
By our arithmetic, holding that guide needs at least about $735M-$775M of free cash over the next three quarters (on the $1.40-$1.50 EPS guide and 480M shares), less than last year's same stretch but a large swing from a burn. Ardent adds a doubt: its earnings jumped, but the cash flow statement shows only about a third came back as cash in one quarter, short of the minimum conversion the finance chief cited; he did not say over what period the 80% applies.
Operating and free cash flow, fiscal years
The second-half cash the guide needs is set against free cash flow that has already come down from its fiscal 2024 level, so the inflow cannot be assumed to repeat.
$ million
| Operating cash flow | Free cash flow | |
|---|---|---|
| May 2023 | 995 | 633 |
| May 2024 | 2,016 | 1,628 |
| May 2025 | 1,692 | 1,303 |
| May 2026 | 1,402 | 979 |
What would have to be true
For the plan to work, volume loss has to stay near what is modelled while frozen pricing lands; transport inflation has to stop rising after the third quarter; Ardent has to keep earning and return most of it in cash; and a large release of working capital has to arrive late in the year. If it does not, the owner is left with high leverage into the next fiscal year and a dividend already halved.
The incentives are plain. Management reset low in July, so clearing the first bar and holding the year builds credibility, and holding rather than raising leaves room if costs rise. On Ardent, the finance chief said it will update at the half. We do not know yet whether the guide moves; the second quarter, which ends in late November, is guided to a margin in the high single digits again.
Conagra set a bar in July, cleared it in September and left the year alone. Its own account of the quarter is that part of the beat was timing. The guide it left alone is where that shows up.
The record: notes, full financial tables
Notes
Impact 4/5 Guidance Mixed
Conagra's 11.5% margin included overhead timing; the held guide implies 9.5-10.2% next
Conagra reported an adjusted operating margin of 11.5% for the quarter to 30 August 2026, against 11.8% a year earlier, and held its full-year guide of 10.0%-10.5%. Adjusted pre-tax income rose $10.0M, but by our arithmetic adjusted operating profit fell $12.8M and Ardent Mills equity earnings added $21.0M. In July the company guided the first quarter to the high single digits. On full-year sales we assume at $10.7-11.0bn, by our arithmetic the full-year guide implies about 9.5%-10.2% for the next three quarters.
“It was roughly $0.03 of our EPS beat. Half of that was a onetime benefit.”— David Marberger, CFO
Impact 4/5 Demand Negative
Conagra's Grocery & Snacks volume fell 5.4% on 3.4% price/mix, past the 1:1 it models
Grocery & Snacks organic volume fell 5.4% in the quarter to 30 August 2026 while price and mix added 3.4%, a ratio of about 1.6 to 1 by our arithmetic. Management's plan assumes 1:1 for the segment and 2:1 for frozen, whose pricing is only now reaching shelves. Refrigerated & Frozen segment volume was down 0.1% last quarter, so that test is still ahead. Price/mix includes mix, so this is not a pure price elasticity, and it is one quarter.
“frozen at more of a 2:1 elasticity that we've modeled for the year in grocery and snacks at more of a 1:1 elasticity”— John Brase, CEO
Impact 3/5 One-off Mixed
Conagra's equity earnings, mostly from Ardent Mills, rose 72% to $50.4M, but about $18M came back as cash
Equity earnings, mostly from Ardent Mills, were $50.4M in the quarter to 30 August 2026, against $29.4M a year earlier, and 36% of the roughly $140M the company assumes for FY27. The cash flow statement shows earnings in excess of distributions of $32.2M, so by our arithmetic about $18.2M was received, 36% of the earnings. The finance chief cited a minimum of 80% conversion, which by our arithmetic would be about $40.3M on the quarter; one quarter can be lumpy, so the year is the test.
“we have a minimum of 80% cash flow conversion on that profit”— David Marberger, CFO
Impact 3/5 Balance sheet Mixed
Conagra's $127.9M free cash burn leaves at least $735M-$775M to find in three quarters
Conagra's free cash flow was negative $127.9M in the quarter to 30 August 2026, against negative $26.2M a year earlier, and net leverage was 3.99x against 3.83x at the end of FY26. By our arithmetic, on the $1.40-$1.50 adjusted EPS guide and about 480M shares, the July guide of above 90% free cash conversion implies at least $735M-$775M over the next three quarters, against $1,004.9M in the same stretch last year. The July guide for year-end leverage of approximately 4x was reaffirmed, and the finance chief said the company is working toward its 3x long-term target.
“We are maniacally focused on getting there as soon as possible.”— David Marberger, CFO
Financials
Income statement, last 8 quarters
| Quarter end | Sales | YoY | Operating profit | Op. margin | PBT | Net profit |
|---|---|---|---|---|---|---|
| Aug 2026 | 2,596 | −1.4% | 268 | 10.3% | 233 | 174 |
| May 2026 | 2,882 | +3.6% | −1,658 | −57.5% | −1,688 | −1,617 |
| Feb 2026 | 2,788 | −1.9% | 280 | 10.0% | 230 | 200 |
| Nov 2025 | 2,979 | −6.8% | −598 | −20.1% | −655 | −664 |
| Aug 2025 | 2,633 | −5.8% | 347 | 13.2% | 289 | 165 |
| May 2025 | 2,782 | −4.3% | 321 | 11.5% | 293 | 256 |
| Feb 2025 | 2,841 | −6.3% | 239 | 8.4% | 189 | 145 |
| Nov 2024 | 3,195 | −0.4% | 403 | 12.6% | 346 | 285 |
Balance sheet
| As of | Equity | Debt | Cash | Fixed assets | Total assets |
|---|---|---|---|---|---|
| Aug 2026 | 6,405 | 7,763 | 372 | 2,824 | 17,702 |
| May 2026 | 6,358 | 7,268 | 218 | 2,863 | 17,274 |
| Feb 2026 | 8,164 | 7,328 | 55 | 2,801 | 19,212 |
| Nov 2025 | 8,091 | 7,628 | 47 | 2,802 | 19,540 |
Cash flow
| Year end | Operating | Investing | Financing | Free cash flow |
|---|---|---|---|---|
| May 2026 | 1,402 | 263 | −1,516 | 979 |
| May 2025 | 1,692 | −542 | −1,158 | 1,303 |
| May 2024 | 2,016 | −375 | −1,657 | 1,628 |
| May 2023 | 995 | −355 | −632 | 633 |