Cisco Systems · CSCO
Cisco lifts its AI revenue target to $9 billion from at least $6 billion in May
Cisco's revenue has topped its own quarterly range in every quarter since fiscal 2026 began; its raised forecast now leans on hyperscaler AI, price rises and a second half stronger than the first.
4 min read Published on

Published by
Inve Content team
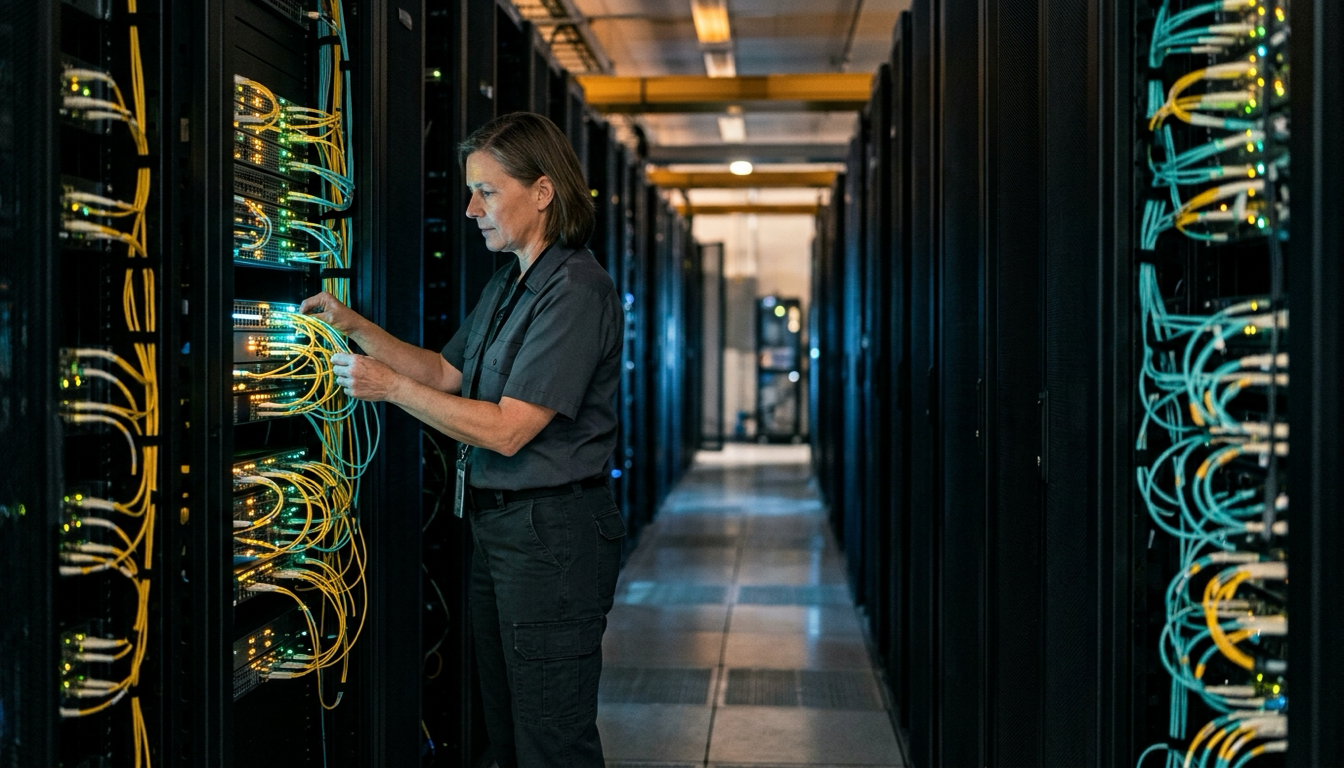
On 12 November Cisco, whose switches, routers and optical parts carry the traffic inside data centres, raised its fiscal 2027 target for AI infrastructure revenue from hyperscalers, the largest cloud operators, to $9 billion. In August the target was $7.5 billion, and in May the company had said at least $6 billion. The whole year went up with it. A holder has to decide how much weight to put on a forecast from a company whose revenue has finished above the top of its own quarterly range in each of the last five quarters, measured against the range given on the call before. The new forecast leans on that AI line and on a second half stronger than the first, and since August Cisco has set its AI target by revenue rather than orders.
The record is plain enough. Mark Patterson, the chief financial officer, said the quarter came in "exceeding the high end of our guidance across revenue, operating margin and EPS, while also delivering strong operating cash flow." The October 2026 quarter extended a run that began in fiscal 2026, after the last quarter of fiscal 2025 landed inside its range. The profit beat did not come from gross margin: on the company's adjusted, non-GAAP measure it stayed inside its range and was lower than a year earlier. It came from costs. Adjusted operating expenses barely rose while revenue grew by about a quarter.
Cisco's revenue topped its own range in every quarter of fiscal 2026 and in the first of fiscal 2027
$m
- Q4 FY25 $-27m
- Q1 FY26 $33m
- Q2 FY26 $149m
- Q3 FY26 $241m
- Q4 FY26 $352m
- Q1 FY27 $317m
Patterson split the raise: of $2.5 billion added to the full-year revenue forecast, $1.5 billion came from hyperscalers and the rest from what he called the core business. Of the growth Cisco now guides for, more than half comes from outside the AI line. In May the company had said the rest of its portfolio should grow in line with its long-term model of 4% to 6%. Part of the difference is price. Patterson said higher prices would add about 5 points to the year's revenue growth, an estimate he gave for total revenue rather than for the core business alone.
More than half of the 19% growth Cisco now guides for comes from outside its hyperscaler AI line
points
- Hyperscaler AI 8 points
- Rest of the business 11 points
The forecast is not spread evenly. The range for the current quarter, the second of the fiscal year, is the same one Cisco gave for last quarter, and its midpoint sits below the revenue last quarter actually delivered. For the year to finish at the midpoint, the two quarters after that have to average about $19.3 billion each, calculated from the guided and reported figures. On the same arithmetic, adjusted earnings per share in each of those two quarters come out slightly below what last quarter earned, even with higher revenue. Patterson also said full-year gross margin would land just shy of 65%. Last quarter's margin was above that level and the current quarter's range starts at it, so the full-year figure leaves the second half below it. Asked about the shape by Amit Daryanani of Evercore ISI, Patterson pointed to a tougher comparison with a year earlier and less visibility than he has for the current quarter, and added that the updated forecast still shows growth speeding up after a record fiscal 2026.
Cisco's full-year guide needs the second half to run above last quarter, after a lower second quarter
$m
Quarterly revenue
- $18,517m Q1 FY27, reported
- $18,100m Q2 FY27, guide midpoint
- $19,341.5m Q3-Q4 FY27, implied average
The AI line is now measured by revenue. In August, reporting fiscal 2026, Cisco said hyperscalers had ordered $9.3 billion of AI infrastructure in the year against about $4 billion of AI revenue, and said that for fiscal 2027 it would give an annual revenue target rather than an orders target. David Vogt of UBS said his own estimate showed hyperscaler AI orders dipping from the quarter before. Charles Robbins, the chair and chief executive, said orders had grown from a year earlier and would be uneven from quarter to quarter: "And that's why we made the decision just to go to the revenue side so that it's just cleaner."
The AI target also counts only the hyperscalers. Robbins said Cisco's business with neoclouds, the newer AI-focused cloud operators, was relatively material and that it has been conservative about their credit, but that it sits outside the AI revenue figure.
The record: full financial tables
Financials
Income statement, last 8 quarters
| Quarter end | Sales | YoY | Operating profit | Op. margin | Other income | PBT | Net profit |
|---|---|---|---|---|---|---|---|
| Oct 2026 | 18,517 | +24.4% | 5,598 | 30.2% | – | 5,495 | 4,552 |
| Jul 2026 | 17,252 | +17.6% | 4,264 | 24.7% | 669 | 4,933 | 3,859 |
| Apr 2026 | 15,841 | +12.0% | 3,960 | 25.0% | 79 | 4,039 | 3,373 |
| Jan 2026 | 15,349 | +9.7% | 3,781 | 24.6% | −135 | 3,646 | 3,175 |
| Oct 2025 | 14,883 | +7.5% | 3,363 | 22.6% | 28 | 3,391 | 2,860 |
| Jul 2025 | 14,673 | +7.6% | 3,087 | 21.0% | −88 | 2,999 | 2,550 |
| Apr 2025 | 14,149 | +11.4% | 3,202 | 22.6% | −255 | 2,947 | 2,491 |
| Jan 2025 | 13,991 | +9.4% | 3,113 | 22.3% | −226 | 2,887 | 2,428 |
Balance sheet
| As of | Equity | Debt | Cash | Investments | Fixed assets | Total assets |
|---|---|---|---|---|---|---|
| Oct 2026 | 51,607 | 29,799 | 7,778 | 8,067 | 3,091 | 129,458 |
| Jul 2026 | 50,285 | 29,533 | 7,218 | 8,700 | 2,760 | 129,637 |
| Apr 2026 | 48,861 | 31,303 | 7,083 | 9,557 | 2,577 | 125,546 |
| Jan 2026 | 47,723 | 30,086 | 7,458 | 8,319 | 2,351 | 123,371 |
| Oct 2025 | 46,873 | 28,089 | 8,400 | 7,336 | 2,248 | 121,102 |
Cash flow
| Year end | Operating | Investing | Financing | Free cash flow |
|---|---|---|---|---|
| Jul 2026 | 14,177 | −3,484 | −12,347 | 12,767 |
| Jul 2025 | 14,193 | 1,733 | −15,815 | 13,288 |
| Jul 2024 | 10,880 | −20,478 | 6,844 | 10,210 |
| Jul 2023 | 19,886 | −5,107 | −11,626 | 19,037 |