
Carnival Corporation · CCL
Carnival keeps beating its guide, but fuel has left the year's EPS goal $0.24 below December's
Carnival raised its fiscal 2026 earnings guide to $2.24, yet it sits $0.24 under December's, and the year-end debt mark set in December did not come up on the September call, while cash went to buybacks.
Published · Updated · Inve Research Desk
Carnival Corporation stock page → More news from Sep 30, 2026

$2.24
FY26 adjusted EPS guide, vs $2.48 in December
The business beat its quarterly guide again, but by our arithmetic unhedged fuel took $0.49 a share across two revisions, and operations and buybacks restored only $0.25.
How they did last quarter
Better than the company said it would be; operating profit was lower than a year ago because fuel cost more, adjusted earnings per share did not move, and net debt was flat in the quarter.
- Adjusted net income$1,963 millionvs about $1.86 billion in the June adjusted net income guidanceAhead of guidance on each of the last five calls, with a smaller margin of beat than in 2025.
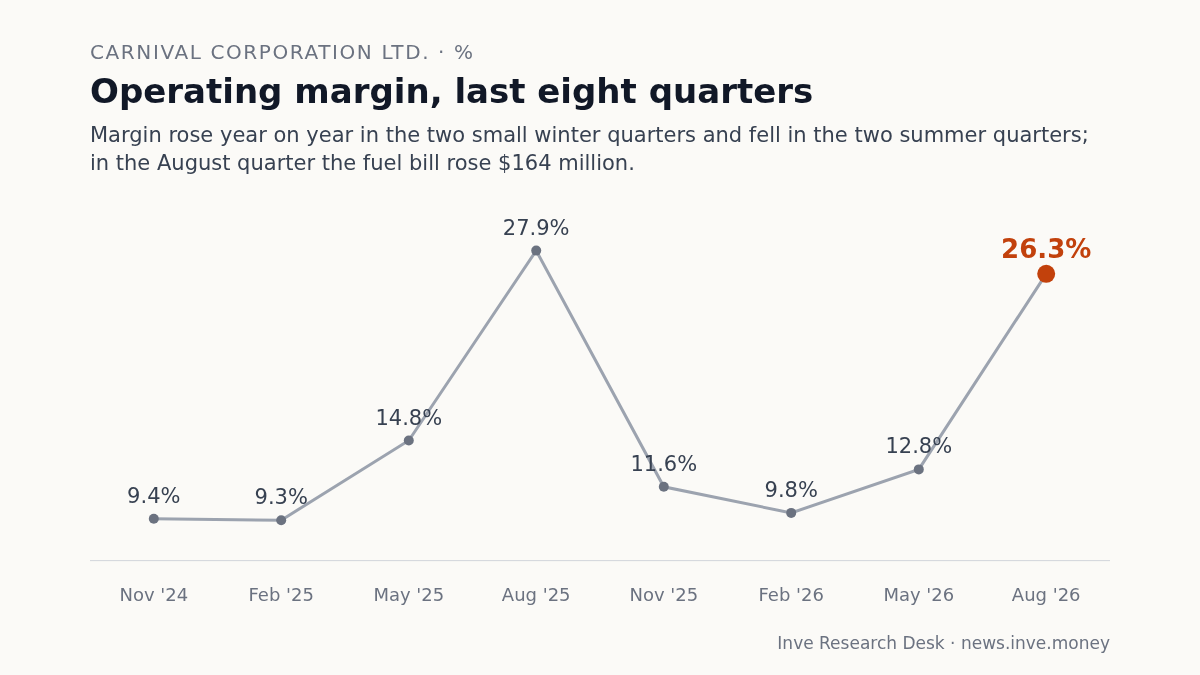
- Operating income and margin$2,220 million, 26.3% marginvs $2,271 million and 27.9% a year agoDown 2.2%: a $164 million rise in the fuel bill more than explains the fall.
- Adjusted earnings per share$1.43vs $1.43 a year agoFlat, though reported net income rose: lower interest and a smaller debt charge, not more operating profit, lifted the reported figure; adjusted EPS leaves out the debt charge.
- Net debt$22,692 millionvs $22,646 million three months earlierNo progress in the quarter toward the debt goal set in December.
The year's guide sits below December's, and fuel is the gap
Carnival has beaten its quarterly earnings guidance again and again, and it will still earn less this year than it told owners in December 2025. That month the company stated adjusted earnings per share of about $2.48 for the fiscal year. Its latest guide, on 29 September 2026, is $2.24. The shortfall is not a mystery. By our arithmetic, it is fuel.
Walk through the year. In March a fuel price shock took thirty-eight cents and better operations gave back eleven. In June the company cut its yield, the price it earns per passenger berth, offset it with cost savings, and still nudged the guide up a cent. By September fuel had taken eleven more and operations and buybacks had added thirteen. Fuel cost forty-nine cents in all; operations and buybacks restored twenty-five. The company does not hedge, and its chief executive called hedging "a short-term band-aid that sometimes pays off, sometimes it doesn't".
Operations ran ahead of plan, but operating profit fell
The business is doing better than the company said it would. Adjusted net income for the quarter that ended in August was $1,963 million against its adjusted net income guidance from June. The company has beaten its prior guidance on each of the last five calls at least, though the beats have shrunk since last year.
Operating profit tells a different story. It fell 2.2%, and the margin shrank from a year ago, as the exhibit below shows. Fuel explains it: the fuel bill rose by more than the whole fall in operating income.
The headline net income came from elsewhere: lower interest and a smaller charge for retiring debt early. Adjusted earnings per share did not move from a year ago.
Cash went to buybacks as the leverage goal went quiet
In December 2025 the company said net debt would fall below three times annual EBITDA (operating profit before depreciation) by the end of the fiscal year. In March 2026 it set a longer-run target of 2.75 times as part of its PROPEL plan. In June it reported a ratio just above three. On the September call it gave no ratio. The chief financial officer said, on leverage, "we expect year-over-year improvement in our balance sheet and leverage metrics"; he added that total debt is now below $24 billion.
The balance sheet may be why. Net debt, debt less cash, was no lower than three months earlier. It is still about $2.0 billion lower than at 30 November 2025, the end of last fiscal year, by our arithmetic. By our arithmetic, getting under three times by year-end would take a fall of more than a billion dollars in the last quarter alone, when that quarter's guided EBITDA is about the same size and capital spending is heavy. That is our reading, not the company's.
The cash went to holders instead. Last quarter, buybacks and dividends took more than the cash left after capital spending, by our arithmetic.
Debt and cash, last four balance-sheet dates
Debt is lower than at the end of last year, but cash fell with it, which is why net debt barely moved last quarter.
$ million
| Debt | Cash | |
|---|---|---|
| Nov 2025 | 26,640 | 1,928 |
| Feb 2026 | 25,290 | 1,424 |
| May 2026 | 24,889 | 2,243 |
| Aug 2026 | 23,912 | 1,220 |
What would have to be true, and what we do not know yet
The company's plan, set out in March, is earnings per share more than half again above 2025's by 2029. From the latest guide that needs at least about 14.6% a year, by our arithmetic. It needs fuel to behave, and the guide for the fourth quarter assumes dearer fuel than last quarter's. It needs yield to outgrow costs, which are guided up 2.2% reported this year. And it needs early 2027 to recover.
That is the open question. Management said spring's booking disruption carried into the first quarter of the next fiscal year, then declined three times to give 2027 yield, a first-quarter exit rate or a starting yield-cost spread, saying it will talk more in December. Notice what was headlined: the improvement in operations since June, rather than a guide below December's. Buybacks added a cent to the guide in June and again in September. We do not know next year's yield, costs or capital spending, or whether debt gets under three times, until the December call.
In each of the last five calls Carnival cleared its earnings bar. The debt mark it set for this year-end is the one it has stopped mentioning.
Carnival Corporation stock page →
The record: notes, full financial tables
Notes
Impact 4/5 Guidance Mixed
Carnival lifts FY26 EPS guide to $2.24, still $0.24 under December's $2.48 on fuel
Carnival raised its fiscal 2026 adjusted EPS guidance by $0.02 to about $2.24 on 29 September 2026: operations added $0.12 and buybacks $0.01, while higher fuel prices took $0.11. The December 2025 release stated about $2.48; by our arithmetic, fuel cost $0.49 across the March and September revisions and operations plus buybacks restored $0.25. The guide was $2.21 in March and $2.22 in June.
“fully offsetting the impact of higher fuel prices that we now expect”— Josh Weinstein, CEO
Impact 4/5 Balance sheet Mixed
Carnival gives no leverage ratio; buybacks and dividends outran free cash flow
In December 2025 the company said net debt would fall below three times its twelve-month adjusted EBITDA by year-end, and it reported 3.1 times in June 2026; on 29 September 2026 it gave no ratio, saying instead that it expects year-over-year improvement in its leverage metrics. Net debt, by our arithmetic from the filed balance sheet, was $22,692 million at 31 August 2026 against $22,646 million at 31 May, though about $2.0 billion below its 30 November 2025 level of $24,712 million. In the August 2026 quarter, buybacks of $549 million and dividends of $204 million exceeded free cash flow of about $712 million, by our arithmetic.
“we expect year-over-year improvement in our balance sheet and leverage metrics”— David Bernstein, CFO
Impact 3/5 Margin Mixed
Carnival's highest-in-8-quarters $1.9B net income came with a 2.2% operating income fall
Net income reached $1,920 million in the August 2026 quarter, the highest of the last eight quarters (November 2024 to August 2026) and up from $1,852 million a year earlier. Operating income fell 2.2% to $2,220 million as fuel expense rose $164 million, with the operating margin at 26.3% against 27.9%. Interest expense net of capitalized interest was $285 million against $317 million, and debt extinguishment costs fell to $23 million from $111 million, together worth $120 million against a $51 million fall in operating income, by our arithmetic. Adjusted EPS was $1.43, unchanged from a year ago.
Impact 3/5 Demand Mixed
Carnival rebuilds FY26 yield guide to 2.3%, recovering about half of June's cut
Carnival guided fiscal 2026 constant-currency net yield to about 2.3% reported, 2.7% normalized, after cutting it by roughly a point in June 2026. That is below the March 2026 guide of about 2.75% reported and 3.25% normalized. Net yield rose 2.4% in the August 2026 quarter, over a point better than guided in June. Costs excluding fuel are now guided up about 2.2% reported against 3.25% in December 2025, so savings are doing the offsetting.
“June was an inflection point in the booking momentum, and it was positive year-over-year”— Josh Weinstein, CEO
Impact 3/5 Risk Mixed
Carnival says spring's booking disruption reached early 2027 but will not size it
The company said the booking disruption that hit second-half 2026 bookings also reached the first quarter of 2027, which it expects to show residual effects. Asked three times for 2027 yield, the first-quarter exit rate or the yield-cost spread, management declined and pointed to the December 2026 call. In June 2026 the CEO called a question on early 2027 premature. The February 2026 quarter was the smallest of the last four reported by operating income ($607 million at a 9.8% margin, against $735 million, $851 million and $2,220 million in the others).
“I'm not foreshadowing anything about Q1 other than it's got a little bit of a different profile.”— Josh Weinstein, CEO
Impact 3/5 Capex Mixed
Carnival flags non-newbuild capex above $2.4B a year for the next few years
The CFO said spending outside new ships, $2.4 billion in 2026, will run somewhat higher for the next few years, though he called it too early to give multiple-year guidance; for next year he pointed to five Evolution ships in dry dock against two in 2026. Capital spending was $698 million in the August 2026 quarter against $648 million a year earlier. The $2.4 billion was already stated in March 2026; the step-up and the dry-dock count are new, and 2027 capex guidance waits for December.
“we do expect to see somewhat higher than the $2.4 billion a year for the next few years”— David Bernstein, CFO
Financials
Income statement, last 8 quarters
| Quarter end | Sales | YoY | Operating profit | Op. margin | Other income | PBT | Net profit |
|---|---|---|---|---|---|---|---|
| Aug 2026 | 8,435 | +3.5% | 2,220 | 26.3% | – | 1,939 | 1,920 |
| May 2026 | 6,663 | +5.3% | 851 | 12.8% | – | 555 | 537 |
| Feb 2026 | 6,165 | +6.1% | 607 | 9.8% | – | 280 | 258 |
| Nov 2025 | 6,331 | +6.6% | 735 | 11.6% | – | 404 | 421 |
| Aug 2025 | 8,153 | +3.3% | 2,271 | 27.9% | – | 1,857 | 1,852 |
| May 2025 | 6,328 | +9.5% | 934 | 14.8% | −353 | 582 | 565 |
| Feb 2025 | 5,810 | +7.5% | 543 | 9.3% | −614 | −71 | −78 |
| Nov 2024 | 5,938 | +10.0% | 560 | 9.4% | −271 | 290 | 303 |
Balance sheet
| As of | Equity | Debt | Cash | Fixed assets | Total assets |
|---|---|---|---|---|---|
| Aug 2026 | 14,188 | 23,912 | 1,220 | 43,397 | 50,971 |
| May 2026 | 12,968 | 24,889 | 2,243 | 43,616 | 52,228 |
| Feb 2026 | 13,031 | 25,290 | 1,424 | 43,700 | 51,567 |
| Nov 2025 | 12,270 | 26,640 | 1,928 | 43,494 | 51,687 |
Cash flow
| Year end | Operating | Investing | Financing | Free cash flow |
|---|---|---|---|---|
| Nov 2025 | 6,218 | −3,321 | −2,189 | 2,607 |
| Nov 2024 | 5,923 | −4,535 | −2,584 | 1,297 |
| Nov 2023 | 4,281 | −2,810 | −5,089 | 997 |
| Nov 2022 | −1,670 | −4,767 | 3,577 | −6,610 |