AT&T · T
AT&T cuts planned network spending, but the savings go into customer growth and interest, not free cash flow
AT&T lowered its capital budget for the next two years by about $1 billion a year yet left free-cash-flow guidance unchanged, because the money is going into paying for devices up front, higher interest and making up for the cash it loses with Mexico.
Published · Inve Research Desk
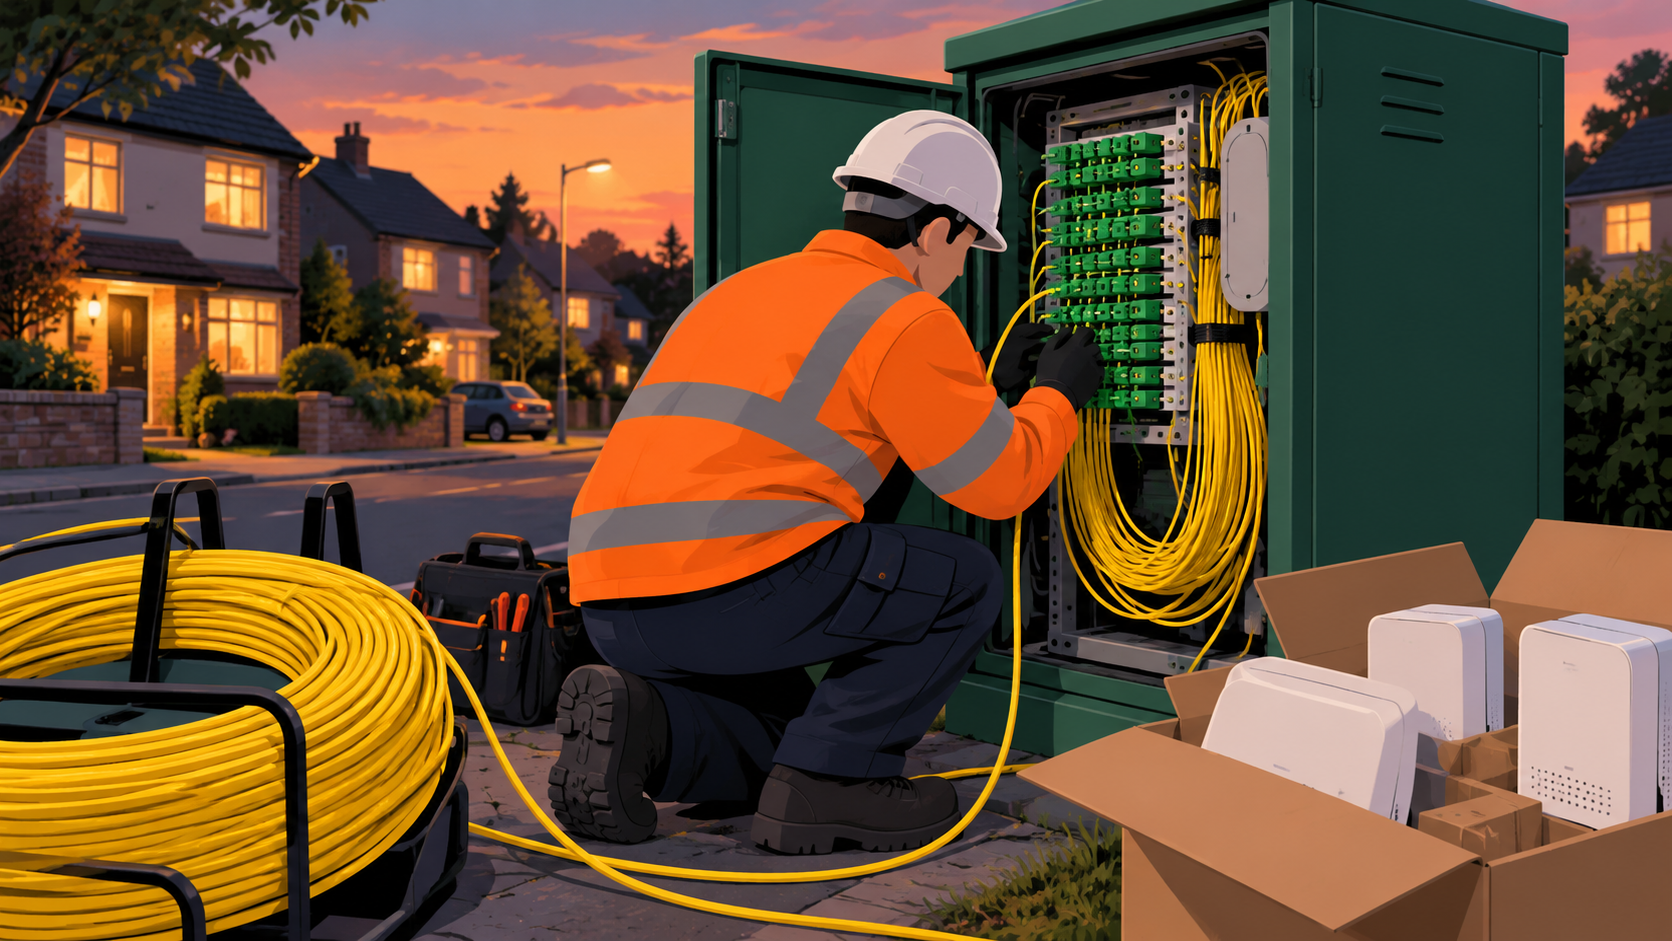
On 21 October 2026 AT&T said it can still reach its goal for fiber coverage by the end of the decade while spending roughly $1 billion a year less on its network than it had planned for the next two years. A saving like that would normally lift free cash flow, the cash left over after running and building the network, which is what pays for the dividend and the buybacks. This time it does not. The free-cash-flow guidance for those two years is the same path management set out in January.
The chief financial officer, Pascal Desroches, said the capital would go back into the business, mostly as working capital to win customers and as higher interest payments. The working-capital part is the cost of equipment. AT&T pays for phones, tablets and home internet gateways soon after it sells them and recovers the money through the monthly bill; as he put it, "we pay upfront and we collect over time, typically the life of the customer". So the faster the company signs people up, the more cash goes out before it comes back.
Part of the saving is a change of perimeter. Of the reduction, $300 million to $400 million is capital that would have gone into the Mexican wireless business, which AT&T has agreed to sell and has taken out of its outlook for those two years. The rest, the CFO said, comes from efficiencies. Selling Mexico also removes cash: he put the loss at $400 million to $500 million a year. The same pattern shows in this year's taxes. Cash taxes will come in below the range the company gave in January, and management said higher interest and the up-front spending on devices absorb the difference.
The interest bill is rising with both higher debt and higher rates. AT&T paid $23 billion for spectrum licences from EchoStar at the end of July, and net debt reached 3.13x adjusted EBITDA, which is earnings before interest, tax, depreciation and amortisation, excluding items the company treats as one-off.
AT&T's balance-sheet debt climbed in the single quarter in which it paid for EchoStar's spectrum
$m
Total debt
- 143954 End of June
- 159627 End of September
Management expects to bring that ratio back to its 2.5x target during 2029, through growth in adjusted EBITDA and by repaying debt with spare cash and the proceeds from a fiber joint venture and the Mexico sale. Meanwhile the buyback stays large: in July the company raised this year's repurchase target by a quarter, to about $10 billion, and it repeated that target last quarter.
Earnings per share point the other way for an accounting reason. The company raised this year's adjusted EPS outlook to about $2.40, mainly because Mexico, now classed as held for sale, is no longer depreciated. The same decision brought a non-cash impairment which, with employee separation charges, left diluted EPS from continuing operations far below the adjusted figure in the September 2026 quarter. Neither the higher outlook nor the impairment changes the cash the business generates, though the roughly $800 million separation charge will be paid out, mostly in 2027.
What the extra spending buys is customers. AT&T reported a record 769,000 net additions of fiber and fixed-wireless internet customers last quarter, revenue from its advanced home internet services grew 23.4% from a year earlier, and the operating margin of its Advanced Connectivity segment rose. The price is lower revenue per fiber customer. The company said that figure fell 4% from a year earlier, after a 1.3% fall in the quarter before, and it expects a similar decline in the current quarter, as promotional pricing, discounts for customers who also take wireless and lower-paying customers in newly acquired territory weigh on it.
Revenue per fiber customer fell faster as AT&T added internet customers at a record pace
%
- Quarter before, year on year -1.3%
- Last quarter, year on year -4%
Free cash flow last quarter was a little higher than a year earlier; the company said operating cash rose because the year-ago quarter included voluntary pension contributions and because of the timing of working-capital payments. For the full year, management said lower cash taxes absorb the device outlay and higher interest, and if the CFO is right that the device outlay comes back over a customer's life, today's working capital becomes later cash. The capital cut, then, mostly changes where the money goes: less into the network, more into handsets, gateways and higher interest. Management said it will set out what drives next year's free-cash-flow outlook with its fourth-quarter report early next year.
The record: full financial tables
Financials
Income statement, last 8 quarters
| Quarter end | Sales | YoY | Operating profit | Op. margin | Other income | PBT | Net profit |
|---|---|---|---|---|---|---|---|
| Sep 2026 | 32,322 | +5.3% | 4,095 | 12.7% | −1,399 | 2,696 | 891 |
| Jun 2026 | 31,558 | +2.3% | 7,038 | 22.3% | −1,216 | 5,822 | 4,627 |
| Mar 2026 | 31,506 | +2.9% | 6,658 | 21.1% | −1,260 | 5,398 | 3,829 |
| Dec 2025 | 33,466 | +3.6% | 5,788 | 17.3% | −1,523 | 4,265 | 3,788 |
| Sep 2025 | 30,709 | +1.6% | 6,119 | 19.9% | 4,534 | 10,653 | 9,314 |
| Jun 2025 | 30,847 | +3.5% | 6,501 | 21.1% | −403 | 6,098 | 4,500 |
| Mar 2025 | 30,626 | +2.0% | 5,754 | 18.8% | 237 | 5,991 | 4,351 |
| Dec 2024 | 32,298 | +0.9% | 5,326 | 16.5% | −18 | 5,308 | 4,080 |
Balance sheet
| As of | Equity | Debt | Cash | Fixed assets | Total assets |
|---|---|---|---|---|---|
| Sep 2026 | 122,754 | 159,627 | 10,767 | 132,154 | 445,871 |
| Jun 2026 | 126,434 | 143,954 | 17,570 | 134,215 | 428,359 |
| Mar 2026 | 125,619 | 138,407 | 11,964 | 133,124 | 421,188 |
| Dec 2025 | 126,491 | 136,100 | 18,234 | 131,559 | 420,198 |
Cash flow
| Year end | Operating | Investing | Financing | Free cash flow |
|---|---|---|---|---|
| Dec 2025 | 40,284 | −18,777 | −6,386 | 19,442 |
| Dec 2024 | 38,771 | −17,490 | −24,708 | 18,508 |
| Dec 2023 | 38,314 | −19,660 | −15,614 | 20,461 |
| Dec 2022 | 35,812 | – | – | 16,186 |