
Applied Digital · APLD
Applied Digital's capital spending rose 60.9% in a quarter to $2.07 billion, paid for mostly with new debt
Capital spending was paid for mostly with new debt, with total debt now at 3.98x equity by our arithmetic, and the next three campuses have no project debt in place yet, by the CFO's account.
Published · Inve Research Desk

$2,074.7M
capital spending last quarter
Up 60.9% on the $1,289.1 million of the quarter before (by our arithmetic); operating cash flow was $63.9 million.
How they did last quarter
Capital spending of $2,074.7 million was up 60.9% on the quarter before, by our arithmetic, while operating cash flow was only $63.9 million.
- Capital spending$2,074.7 million, against $249.9 million a year earliervs $1,289.1 million the quarter before, up 60.9% by our arithmeticSpending rose 60.9% on the quarter before, by our arithmetic, while operating cash flow was $63.9 million.
- Revenue$341.9 million, up 322% on a year ago (322.4% by our arithmetic)vs $258.7 million the quarter before (filed), up 32.1% by our arithmeticFit-out, $183.5 million at about 4% margin by our arithmetic, is over half of revenue; base rent was $65.8 million. Capital spending was 607% of revenue, by our arithmetic.
- Operating margin-18.2% by our arithmetic (operating loss $62.4 million)vs -48.2% the quarter before (filed) and -12.1% a year ago, by our arithmeticBetter than the quarter before, still worse than a year ago.
Capital spending jumped, mostly on borrowed money
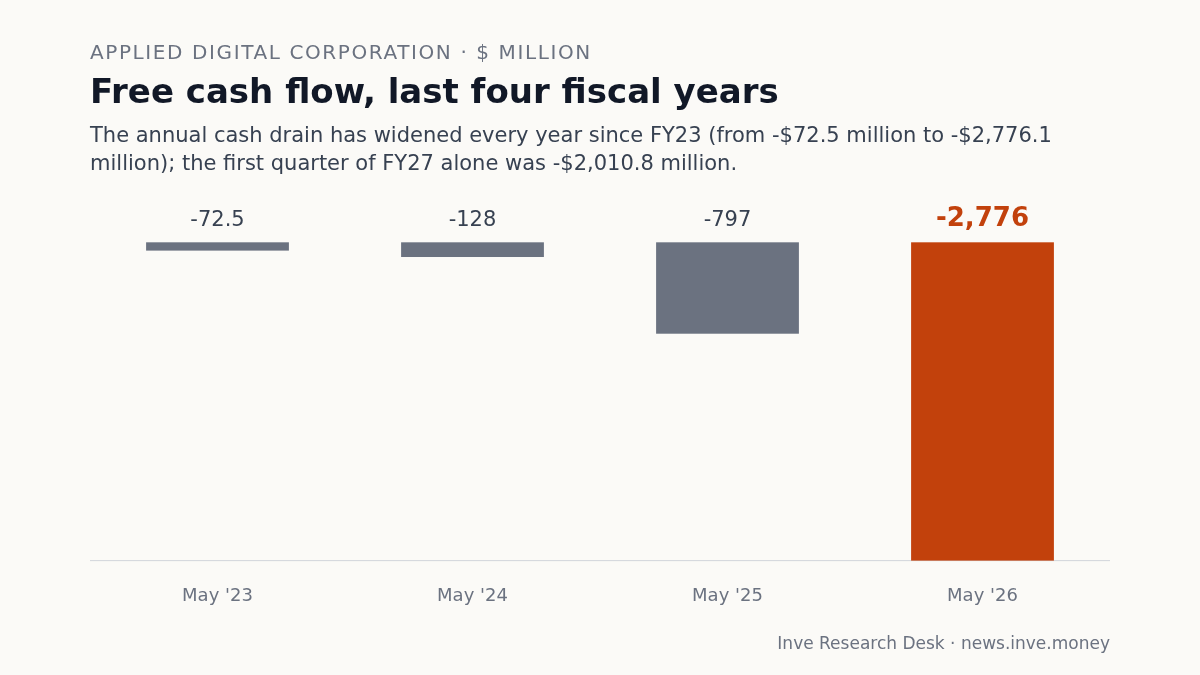
The filed cash flow statement shows $2,074.7 million spent on property and equipment in the latest quarter, up sharply on the quarter before. Operations produced only a small fraction of that in cash, so the rest came from net borrowing of about $1.4 billion, $275 million of preferred stock and a $475.5 million fall in cash (by our arithmetic).
In July the chief financial officer said spending would step up as construction moved into more advanced stages. On this call, the company gave no figure for capital spending, for the quarter or ahead.
The build is paid for with borrowed money
Debt is now 3.98x the equity attributable to shareholders, by our arithmetic. In the three quarters since the end of November fixed assets more than tripled while equity rose only about 11%, and equity fell 6.7% in the latest quarter, by our arithmetic, after a net loss.
The next stage is not yet financed. The remaining campuses, by our arithmetic from the contracted total less what has been funded, have no project debt in place. In July the CFO expected that financing to be relatively straightforward; on this call he spoke of active discussions with lenders and a high level of confidence.
Equity and fixed assets, last four quarters
Fixed assets more than tripled while equity rose only about 11%, from $1,449.6 million to $1,602.5 million.
$ million
| Equity | Fixed assets | |
|---|---|---|
| Nov 2025 | 1,450 | 2,002 |
| Feb 2026 | 1,581 | 3,012 |
| May 2026 | 1,718 | 4,236 |
| Aug 2026 | 1,603 | 6,330 |
Dates moved while the money got bigger
Power from Base Electron, the developer the company part-owns, has slipped, from towards the end of 2028 in April to deliveries beginning in 2030 in October.
Other dates moved too. Harwood's start has moved from January's shortly after mid-year to the end of the calendar year; that was already in the company's guide by April and in the annual report filed in July, so October's date is unchanged from the filed one. The expansion leases, which in July meant one at Polaris Forge 2 (expected in the near term in April and July) and one at a Delta Forge campus, are now dated to be executed by calendar year-end; the call named no campus split.
3.5-4 GW needs more than the past 12 months' 250 MW
The chief executive said the company has the ability to grow to 3.5 to 4 gigawatts operating by the end of 2030, if demand continues on its current path. Reaching his waypoint of about 2 gigawatts by the end of 2028, from the 300 MW the company expects live in North Dakota at the end of calendar 2026, means adding about 850 MW a year, by our arithmetic; the company put 250 MW into service in the past year and expects to place over 600 MW into service in the next year, on the call; even that falls short of the rate the waypoint needs, by our arithmetic. In July he cited a supply chain limit that was already being exceeded a little (he also said the company had been able to keep expanding that limit); on this call he said the company is pushing to secure more because it expects to need it in the coming years.
What would have to be true, and what we do not know
For the plan to work, project debt on the scale already raised for the first campuses would be needed again for the others. Deliveries must run above even the rate the company expects for the next year, the power must arrive, and the expansion leases must be signed.
We do not know what next quarter's spending will be. We will see in January whether the leases were signed by the end of December.
The record: notes, full financial tables
Notes
Impact 5/5 Capex Negative
Applied Digital's capital spending rose 60.9% to $2,074.7M in the quarter to 31 August
Capital spending was $2,074.7 million in the quarter to 31 August, up 60.9% on the $1,289.1 million of the quarter before and against $249.9 million a year earlier (by our arithmetic), and operating cash flow was $63.9 million. On 27 July the CFO said to expect around $600 million for the upcoming quarter, adding that spending would step up; the quarter to 31 May had already cost $1,289.1 million, so the figure does not look like the same measure as the cash-flow total, and the 7 October call did not explain it.
Impact 4/5 Balance sheet Mixed
Applied Digital has 810 MW of campuses without project debt, with debt at 3.98x equity
Three campuses totalling 810 MW, by our arithmetic from 1.41 GW contracted less 600 MW funded, have no project debt in place. Debt of $6,376.6 million against equity attributable to shareholders of $1,602.5 million at 31 August is a ratio of 3.98x, by our arithmetic. In July the CFO expected this financing to be relatively straightforward; on this call he described active discussions with lenders and announced no financing.
“we have a high level of confidence in our ability to fund these campuses at favorable rates and terms”— Mohammad Saidal Mohmand, chief financial officer
Impact 4/5 Guidance Mixed
Applied Digital: 3.5-4 GW by 2030; waypoint needs about 850 MW a year, by our arithmetic
The chief executive said the company has the ability to grow to 3.5 to 4 gigawatts by the end of calendar 2030, if demand continues. By our arithmetic, reaching his 2 GW waypoint (a bridge to the top of the range) by the end of 2028 from 300 MW live in North Dakota at end-2026 needs about 850 MW a year. In July he cited about 700 MW a year of supply chain, already exceeded a little, and said the company had been able to keep expanding that limit; on this call he said the company is pushing to secure more. The quote is for the top of the range.
“that really has us delivering about 1 gigawatt per year in '29 and '30, right?”— Wesley Cummins, chief executive
Impact 3/5 Risk Negative
Applied Digital's Base Electron power now due from 2030, after end-2028 in April
Base Electron, the developer in which the company owns about 10%, signed a long-term power purchase agreement for a roughly 1,200 MW gas plant at Center, North Dakota. In April the chief executive said it would start commissioning new generation towards the end of 2028; in July he put initial capacity in 2029 and 2030. The October call dated deliveries to 2030.
“with deliveries expected to begin in 2030”— Wesley Cummins, chief executive
Impact 3/5 Guidance Mixed
Applied Digital expects 250 MW of expansion leases by year-end at 15%-plus higher rates
The company expects about 250 MW of expansion leases to be signed by calendar year-end. In July the company split these as 100 MW at Polaris Forge 2 and 150 MW at a Delta Forge campus, and the chief executive expected the 100 MW to be contracted in the near term; this call set a date, and the 15%-plus rise he cited is the first price figure on these leases in the January, April and July calls (searched). It is an expectation, not a signed lease.
“definitely north of up 15%-plus increases on the lease rate”— Wesley Cummins, chief executive
Impact 3/5 Demand Mixed
Applied Digital's ChronoScale targets $1 billion of annual recurring revenue in 2027
The company said its 96%-owned subsidiary ChronoScale is on track for $1 billion of annual recurring revenue in 2027. ChronoScale revenue was $41.5 million in the quarter to 31 August, including about $23 million of GPU hardware sales, so about $18.5 million excluding them, by our arithmetic. ARR is not defined on the call; that revenue annualises to about $74 million, by our arithmetic, so the target is about 13.5 times that. We found no recurring-revenue target for it in the January, April or July calls.
“ChronoScale is on track to reach $1 billion of ARR in 2027”— Wesley Cummins, chief executive
Financials
Income statement, last 8 quarters
| Quarter end | Sales | YoY | Operating profit | Op. margin | PBT | Net profit |
|---|---|---|---|---|---|---|
| Aug 2026 | 342 | +322.6% | −62.4 | −18.3% | −166 | −184 |
| May 2026 | 294 | +181.0% | −97.5 | −33.2% | −58 | – |
| Feb 2026 | 127 | +139.3% | −85.7 | −67.7% | −71 | – |
| Nov 2025 | 127 | +249.7% | −31.0 | −24.5% | −27 | −15 |
| Aug 2025 | 81 | +132.5% | −9.8 | −12.1% | −17 | −17 |
| May 2025 | 105 | +139.4% | −65.7 | −62.8% | −83 | – |
| Feb 2025 | 53 | +22.2% | −18.9 | −35.7% | −35 | – |
| Nov 2024 | 36 | −14.2% | −12.8 | −35.4% | −128 | −139 |
Balance sheet
| As of | Equity | Cash | Fixed assets | Total assets |
|---|---|---|---|---|
| Aug 2026 | 1,603 | 2,950 | 6,330 | 11,707 |
| May 2026 | 1,718 | 1,592 | 4,236 | 9,929 |
| Feb 2026 | 1,581 | 1,730 | 3,012 | 6,247 |
| Nov 2025 | 1,450 | 1,913 | 2,002 | 5,229 |
Cash flow
| Year end | Operating | Investing | Financing | Free cash flow |
|---|---|---|---|---|
| May 2026 | 90 | −2,936 | 6,877 | −2,776 |
| May 2025 | −115 | −668 | 875 | −797 |
| May 2024 | 14 | −172 | 147 | −128 |
| May 2023 | 59 | −132 | 71 | −73 |